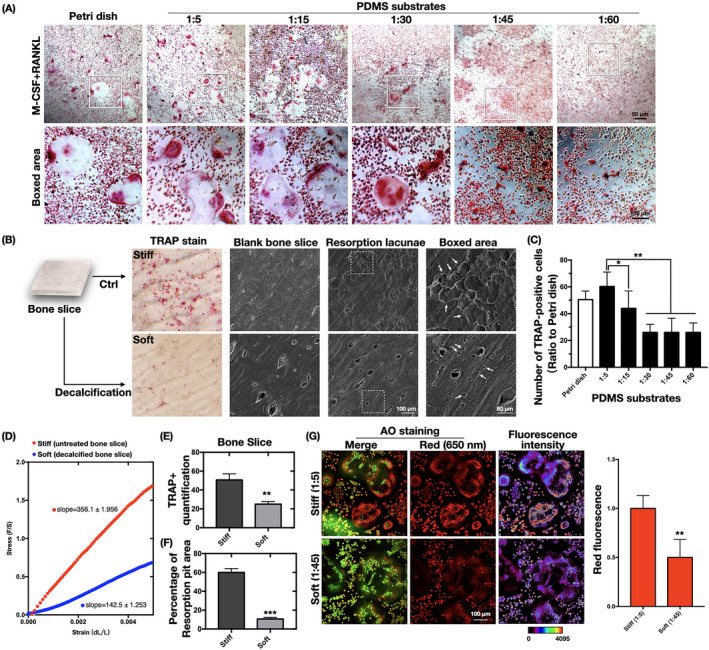
FIGURE 4.

Substrate stiffness induces bone absorption function changes in osteoclasts. (A) Representative images of osteoclasts with TRAP staining after induction with M‐CSF and RANKL for 7 days (n = 3 independent experiments). (B) The same experiment in (A) was carried out with cells cultured on untreated bone slices (stiff) or decalcified bone slices (soft). The left column displays representative TRAP‐stained osteoclasts on the bone slices. The second column shows SEM images of untreated bone slices (stiff) and decalcified bone slices (soft) (n = 3 independent experiments). SEM images of bone resorption pits (indicated by white arrows) are displayed on the two right‐most columns. (C) Quantification of TRAP‐positive cells in (A). Data are the mean ±SD (n = 3). *p < .05, **p < .01. (D) Representative stress–strain curves of differently treated bone slices, obtained by tensile testing. The scatter points (n = 100) are derived from the linear elastic region. (E) Quantification of TRAP‐positive cells in (B). Data are the mean ±SD (n = 3). **p < .01. (F) ImageJ quantification of the resorption area measurements in (B). Data are the mean ±SD (n = 3). ***p < .001. (G) CLSM images of acridine orange (AO)‐stained (ie, acidified) osteoclasts cultured on PDMS substrates (n = 3 independent experiment). The red fluorescence of cytoplasmic vesicles indicates an acidic pH, whereas green‐stained nuclei indicate a neutral pH. The calibration bar indicates the false color correspondence to the 12‐bit pixel intensities of the right‐most columns. ImageJ was used to quantify the red fluorescence (n = 3). **p < .01
