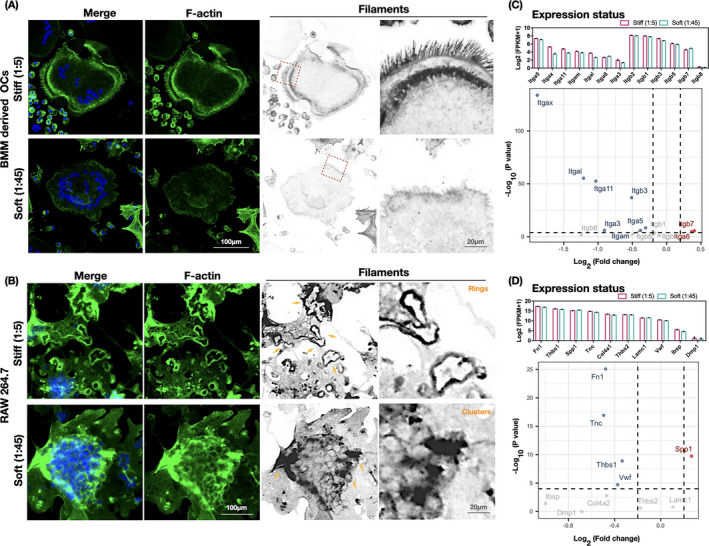
FIGURE 5.

Integrin–ECM profile enrichment of osteoclasts changes with substrate stiffness. (A, B) Remodeling of the cytoskeleton architecture of osteoclasts differentiated from bone marrow precursor cells and RAW 264.7 monocytic cells. Representative immunofluorescence images of osteoclasts counterstained for F‐actin (phalloidin, green) and nuclei (DAPI, blue) display changes in the F‐actin bundles on PDMS substrates of different rigidity (n = 3 images). (C) RNA sequencing results indicating the expression landscape of 13 significant genes in the integrin family, screened at padj ≤0.05, in cell samples (n = 3 biological replicates) collected from different PDMS substrates (1:5 and 1:45). The upper statistical plot demonstrates the transcriptome expression status of the screened integrin genes, presented as log2 (1 + FPKM). The volcano plots summarize the expression levels of the genes. Comparing soft with stiff samples, downregulated genes are shown as blue dots, upregulated genes as red dots, and nonsignificant genes as gray dots (Threshold: p < .0001). (D) RNA sequencing results indicating the expression landscape of integrin αvβ3 interacting with ECM ligands in the ECM–receptor interaction pathways (KEGG) in samples (n = 3 biological replicates) collected from PDMS substrates of different rigidity (1:5 and 1:45). The upper statistical plot indicates the transcriptome expression status of select ECM ligands, presented as log2 (1 + FPKM). The volcano plots summarize the expression levels of the ECM ligands. Comparing soft with stiff samples, downregulated genes are shown as blue dots, upregulated genes as red dots, and nonsignificant genes as gray dots (Threshold: p < .0001)
