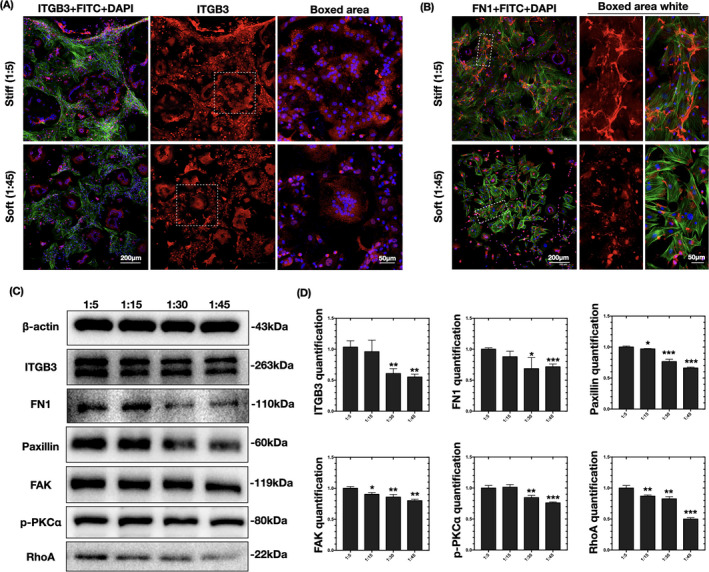
FIGURE 6.

Changes in fibronectin–integrin signaling pathways. (A, B) Representative immunofluorescence images of ITGB3 and FN1 (red stained) on PDMS substrates of different rigidity (n = 3 independent experiments). The osteoclasts were counterstained for F‐actin (phalloidin, green) and nuclei (DAPI, blue). (C) Western blots showing the expression levels of ITGB3, FN1, paxillin, FAK, p‐PKC, and RhoA on PDMS substrates of different rigidity (n = 3 independent experiments). (D) Quantification of the changes in ITGB3, FN1, paxillin, p‐PKC, FAK, and RhoA levels in (C). Data are the mean ±SD (n = 3). *Significant difference relative to group (1:5). *p < .05, **p < .01, **p < .001
