FIGURE 1.

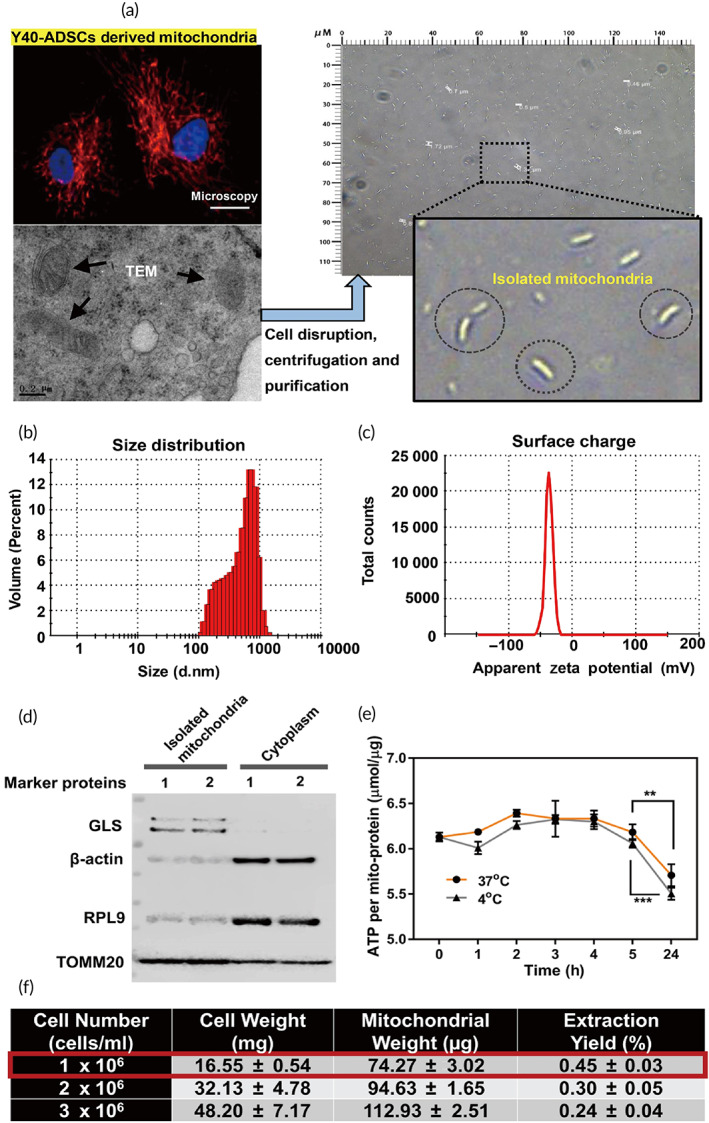
Characterization of donor Y40‐ADSCs derived mitochondria. (a) (left) Mitochondrial distribution and representative transmission electron microscopy (TEM) image of intracellular mitochondria in Y40‐ADSCs. Scale bar, 10 μm and 0.2 μm, respectively; (right) Images of isolated intact mitochondria. (b) Size distribution of isolated mitochondria. (c) Zeta potential of isolated mitochondria. (d) Western blot analysis of isolated mitochondria. TOMM20 and GLS are mitochondrial markers, RPL9 and β‐actin are cytoplasmic protein markers (three independent samples concentrated for one WB test). (e) Comparison of adenosine 5′‐triphosphate (ATP) change during the storage of isolated mitochondria at 4°C and 37°C (n = 8). (f) Mitochondrial isolation efficiency from different cell number (cells/ml) (n = 3). Significantly different (one‐way analysis of variance [ANOVA]): **p < 0.01 and ***p < 0.001
