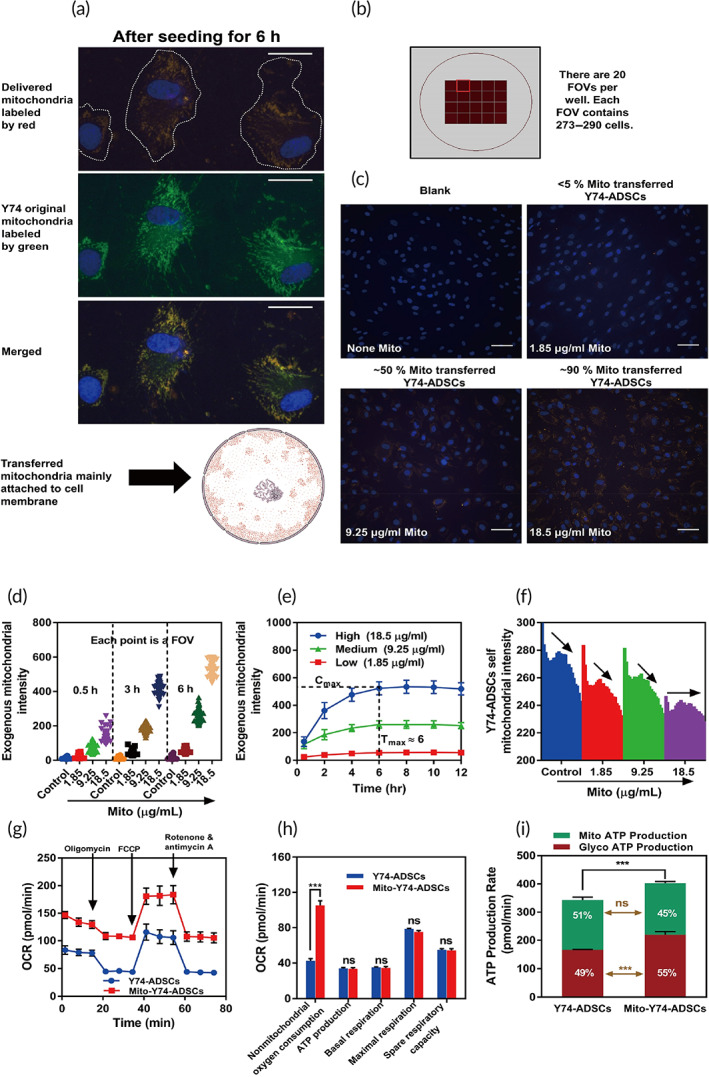
FIGURE 2.

Intracellular transplantation of isolated mitochondria into recipient Y74‐ADSCs through endocytosis. (a) Intracellular localization of isolated exogenous mitochondria (red labeling) with self‐original mitochondria in Y74‐ADSCs (green labeling). Scale bar, 10 μm. (b) Mitochondrial morphology, colocalization, and mitochondrial uptake rate were visualized and quantified by live‐cell high‐content analysis. (c) The presence of exogeneous mitochondria‐positive Y74‐ADSCs after 12 h incubation. (d) Time‐dependent intracellular uptake of isolated mitochondria. (e) Dose‐dependent intracellular uptake of isolated mitochondria. (f) The tendency of exogenous mitochondria (low to high concentration with 12 h incubation) to balance mitochondrial fission/fusion dynamics in Y74‐ADSCs. (g) Oxygen consumption rates (OCRs) following the Seahorse Mito Stress Test assay in Y74‐ADSCs before and after mitochondrial transplantation. (h) The parameters within the Cell Mito Stress assay after 6 h, including mito ATP production, basal respiration, maximal respiration and spare respiratory of samples in (f). (i) Mitochondrial transplantation increased glycolytic adenosine 5′‐triphosphate (ATP) production rate in Y74‐ADSCs determined by Seahorse XF Real‐Time ATP Rate Assay after 6 h. Significantly different (one‐way analysis of variance [ANOVA]): ns, not significant and ***p < 0.001
