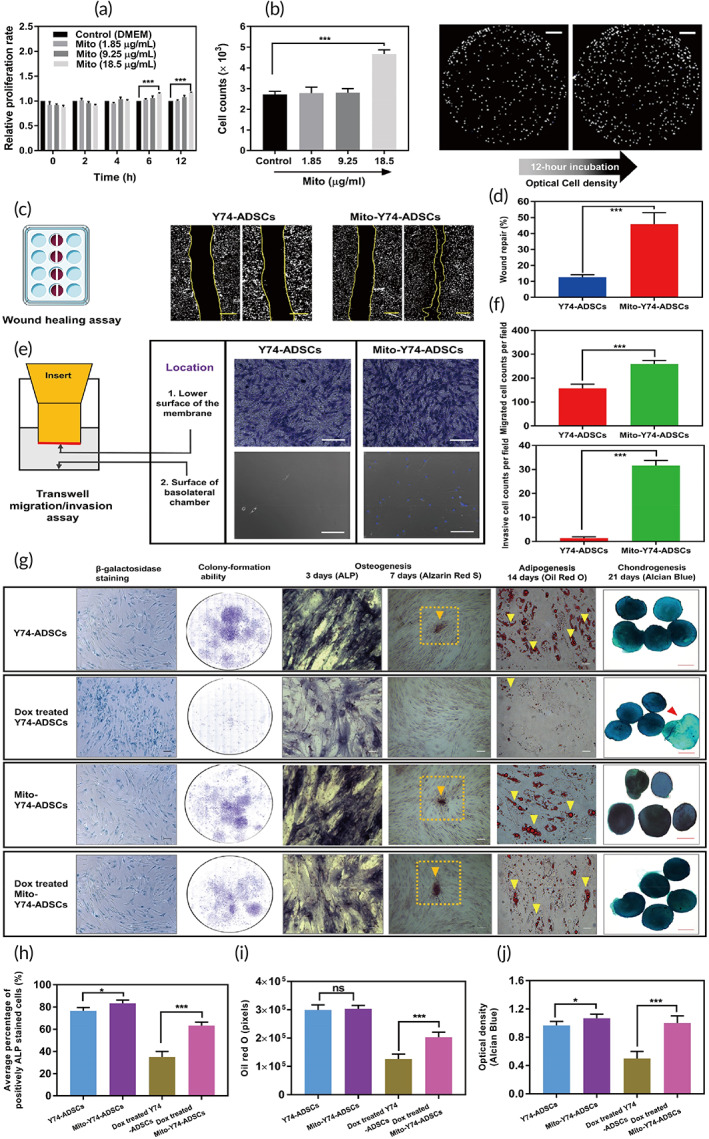
FIGURE 3.

Improved stress tolerance of mito‐transferred Y74‐ADSCs against serum starvation and oxidative stress in vitro. (a) The 12 h changes in Y74‐ADSCs cell proliferation with low glucose Dulbecco's Modified Eagle's medium (DMEM) after treated with different mitochondrial dosage (n = 6). (b) Cell counts and density change of groups in A, images taken by EOVS M7000 microscope. (c) Representative images of migration in mito‐transferred Y74‐ADSCs versus control Y74‐ADSCs (n = 3). Scale bars, 100 μm. (d) Percentage area of repaired wound. (e) Representative images of transwell migration assay in mito‐transferred ADSCs versus control ADSCs (n = 3). Scale bars, 50 μm. (f) Quantitative analysis of migrated cells by transwell assay. (g) Comparison of β‐galactosidase staining (blue), colony formation and multipotency of mito‐transferred Y74‐ADSCs versus control Y74‐ADSCs with and without doxorubicin‐induced oxidative stress. (h) ALP expression of representative cells in each group (n = 6). (i) Oil red O intensity of lipid droplets in each group (n = 6). (j) Optical density (blue) of Alcian blue staining (n = 5). Significantly different (one‐way analysis of variance [ANOVA]): ns, not significant, *p < 0.05, and ***p < 0.001
