FIGURE 5.

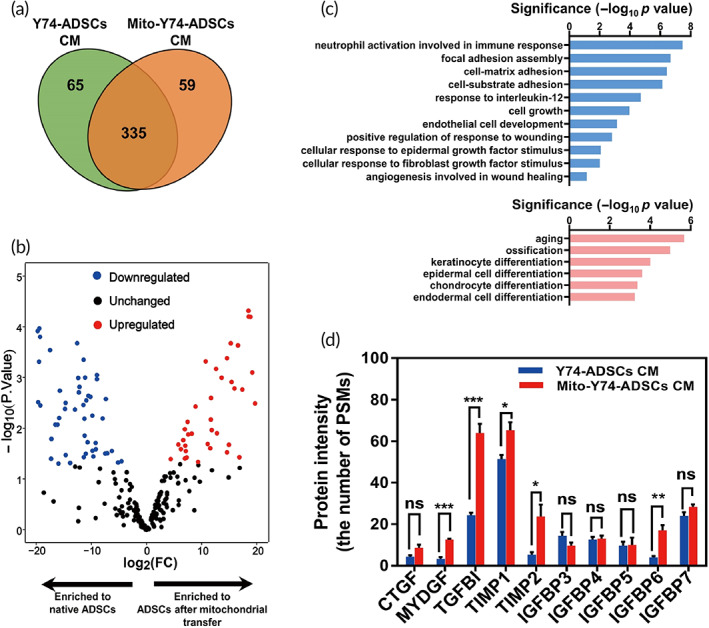
Cellular secretome changes that occur with mitochondrial transfer. (a) Venn diagram depicting unique and shared proteins in conditioned media (CM) derived from mito‐transferred Y74‐ADSCs versus control Y74‐ADSCs (n = 3). (b) Volcano plot indicating protein distribution in CM after mitochondrial transfer, as determined by quantitative proteomics. Positive (red; upregulated) and negative (blue; downregulated) correlations showed the log2 fold expression changes (log2FC > 2, <−2, and p < 0.05). (c) Gene Ontology analysis of functional annotations upregulated (top) and downregulated (bottom) by mitochondrial transplantation. (D) Several proteins involved in “immune response” and “cell growth” secreted in significantly different quantities by mito‐transferred Y74‐ADSCs versus control Y74‐ADSCs. Data are presented as the average number of PSMs. Significantly different (one‐way analysis of variance [ANOVA]): ns, not significant, *p < 0.05, **p < 0.01, and ***p < 0.001. CTGF, connective tissue growth factor; MYDGF, myeloid‐derived growth factor; TGFBI, transforming growth factor beta induced; TIMP1 and 2, tissue inhibitor matrix metalloproteinase 1 and 2; IGFBP3‐7, insulin‐like growth factor binding proteins family 3‐7
