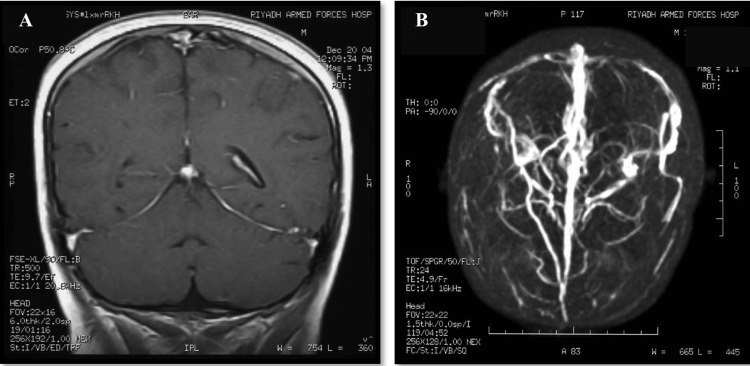
Figure 4. Follow-up imaging showing (A) coronal T1 MRV with good opacification of the venous sinuses and (B) follow-up post-contrast 3D MIP demonstrating re-canalization of the dural venous sinuses.
MRV: magnetic resonance venogram, 3D MIP: 3-dimensional Maximum intensity projection, T1: longitudinal relaxation time.

