Figure 5.
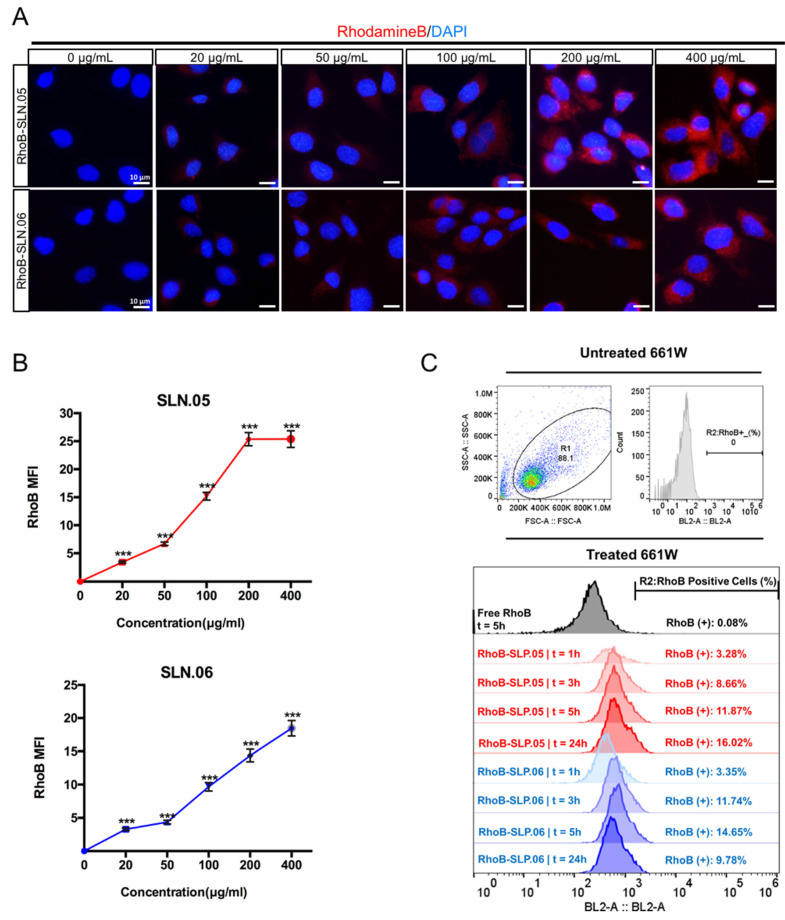
Internalization of SLN.05 or SLN.06 by 661W cells. (A) Visualization of internalized SLN by 661W cells using rhodamine B-loaded SLN (RhoB-SLN). Micrographs of internalized RhoB-SLN.05 or RhoB-SLN.06 (red signal) at various concentrations after 5 h of exposure. Nuclei were stained with DAPI in blue. Scale bar: 10 µm. (B) Mean fluorescence intensity (MFI) of rhodamine B signal inside the cells was quantified using the ImageJ software (ncells ≥ 10). (C) Histogram overlay of RhoB relative fluorescence intensity and percentage of RhoB-positive cells (RhoB+) assessed by Flow cytometry. R1: gating for selecting cell population; R2: gating to select RhoB+ cells based on blue laser (BL2-A) detector; FSC-A: forward scattering channel; SSC-A: side scattering channel. Significance at *** p < 0.001; ANOVA followed by Bonferroni’s post hoc test.

