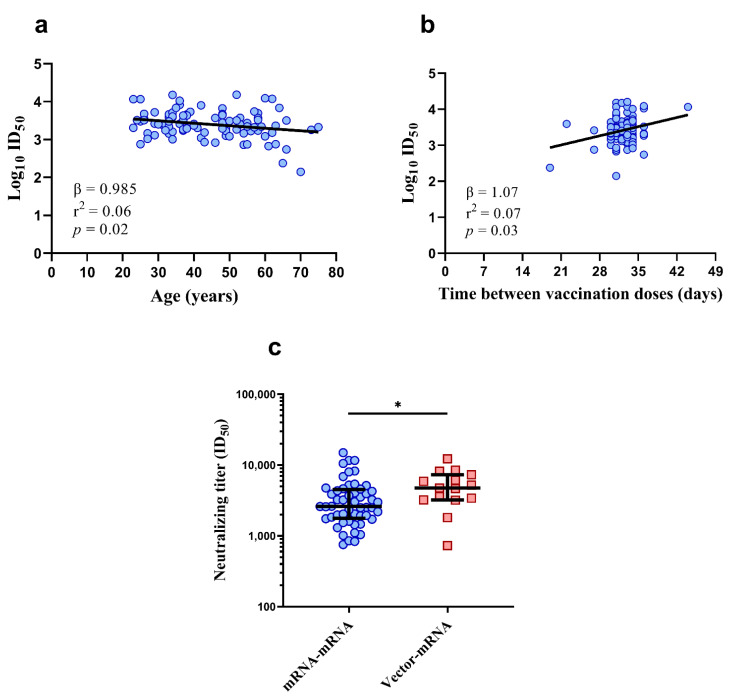
Figure 3.
Distribution of neutralizing titers with age (a) and time between vaccination doses (b) in the mRNA–mRNA group (n = 96). Comparison of age-matched neutralizing titers between the mRNA–mRNA (n = 52, blue circles) and vector–mRNA (n = 15, red squares) groups (c). Despite age-matching, neutralization titers remained significantly higher in the vector–mRNA group (* p = 0.020, Mann–Whitney U test). For (a,b), the bold lines represent the linear regression. For (c), the bold lines represent the median and interquartile range.

