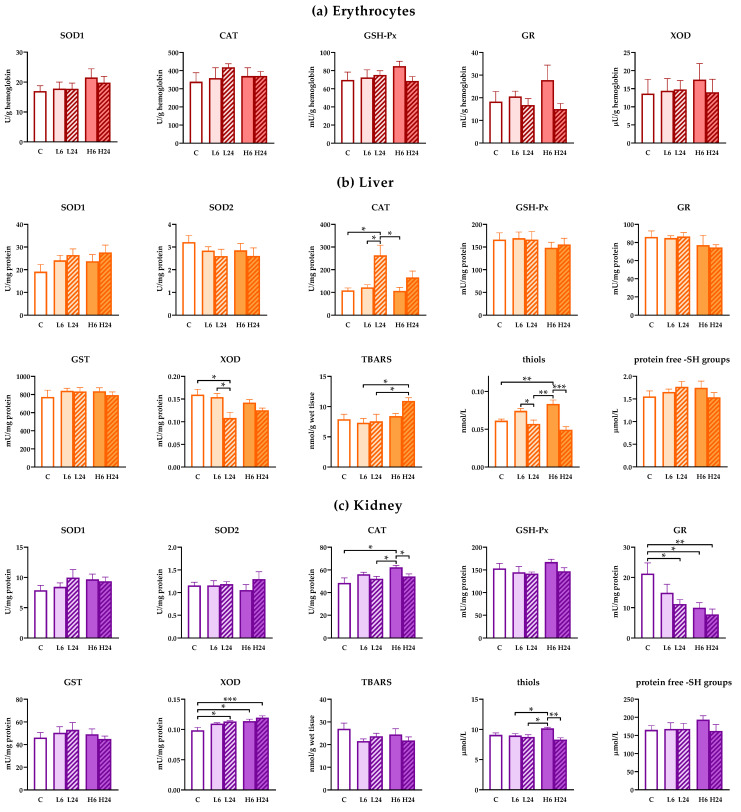
Figure 2.
Antioxidant enzyme, glutathione S-transferases (GST) and xanthine oxidase (XOD) activities and concentration of TBARS, thiols and protein ‒SH groups in erythrocytes, liver and kidney of female rats treated with ibogaine. (a) Ibogaine caused no significant changes in the activities of either superoxide dismutase (SOD), catalase (CAT), glutathione peroxidase (GSH-Px), glutathione reductase (GR) or XOD in erythrocytes. (b) In liver ibogaine altered the activities of CAT (one-way analysis of variance (ANOVA): F = 6.77, p < 0.001; two-way ANOVA—time: F = 12.26, p < 0.01) and XOD (one-way ANOVA: F = 3.99, p < 0.05; two-way ANOVA—time: F = 9.16, p < 0.01) as well as concentrations of TBARS (one-way ANOVA: F = 2.99, p < 0.05; two-way ANOVA—time: F = 8.02, p < 0.05) and thiols (one-way ANOVA: F = 11.05, p < 0.001; two-way ANOVA—time: F = 29.67, p < 0.001). (c) In kidney ibogaine altered the activities of CAT (one-way ANOVA: F = 3.63, p < 0.05; two-way ANOVA—time: F = 9.02, p < 0.01), GR (one-way ANOVA: F = 4.80, p < 0.01; two-way ANOVA—dose: F = 4.23, p < 0.05) and XOD (one-way ANOVA: F = 6.63, p < 0.001; two-way ANOVA—dose: F = 4.86, p < 0.05) as well as the concentrations of thiols (one-way ANOVA: F = 5.10, p < 0.01; two-way ANOVA—time: F = 12.42, p < 0.01; interaction: F = 7.49, p < 0.05). The control group (C) was treated with dH2O; other groups were treated with ibogaine as follow: 1 mg/kg b.w. decapitated after 6 h (L6), 1 mg/kg b.w. decapitated after 24 h (L24), 20 mg/kg b.w. decapitated after 6 h (H6), 20 mg/kg b.w. decapitated after 24 h (H24). Significant differences between individual groups obtained by Tukey’s HSD test are shown in the figure; *—p < 0.05, **—p < 0.01, ***—p < 0.001.

