Figure 4.
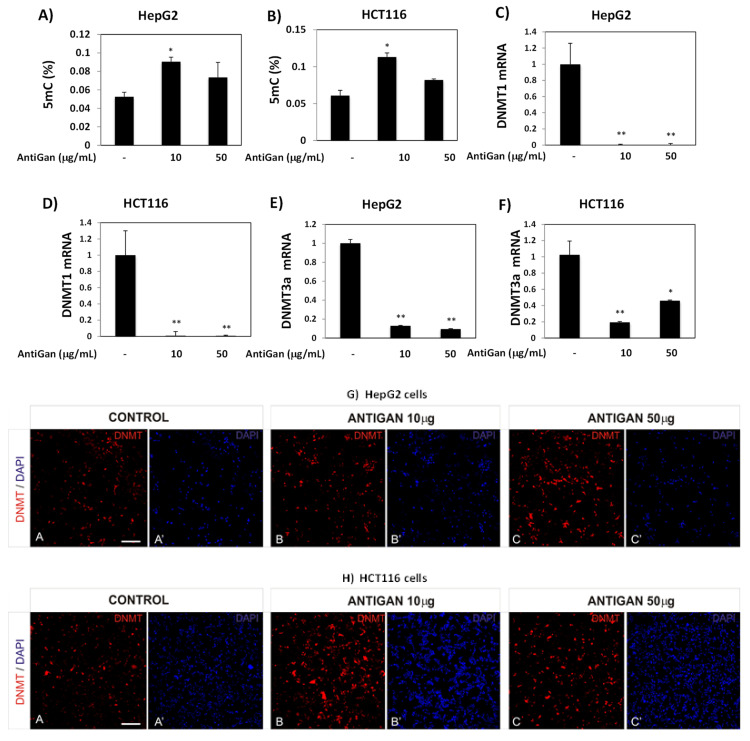
AntiGan regulates DNA methylation in liver and colorectal cancer cell lines. HepG2 and HCT116 cells were treated with AntiGan (10 and 50 µg/mL) for 48 h. Global DNA methylation (5mC) levels were measured in HepG2 (A) and HCT116 (B) cells and expressed as percentages. DNMT1 mRNA levels were measured by qPCR in HepG2 (C) and HCT116 (D) cells. DNMT3a mRNA levels were also measured by qPCR in HepG2 (E) and HCT116 (F) cells. Results are expressed as fold-change compared with untreated cells. HepG2 (G) and HCT116 (H) cells were immunostained with an antibody against DNMT3a (red). A, A’ Control cells; B, B’ ANTIGAN 10 ug/mL; C, C’ ANTIGAN 50 ug/mL. DAPI (in blue) was used to mark nuclei. Apostrophe indicates DAPI staining. Data are expressed as mean ± S.E.M. Statistical significance between groups was calculated with one-way ANOVA with post hoc Bonferroni correction for multiple comparisons and it is shown as * p < 0.05 and ** p < 0.01. 5mC, 5-methylcytosine; qPCR, quantitative real-time PCR. Scale bar, 100 µm for all images.

