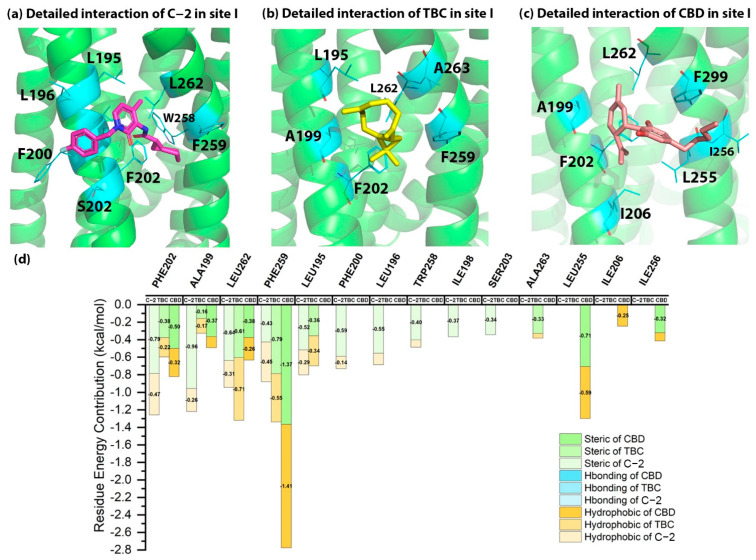
Figure 5.
The detailed interactions and residue energy contribution of C-2, TBC and CBD in site I. (a) The detailed binding pose of C-2 in site I. (b) The detailed binding pose of TBC in site I. (c) The detailed binding pose of CBD in site I. (d) The comparisons of residue energy contribution of binding residues for these AMs in site I.

