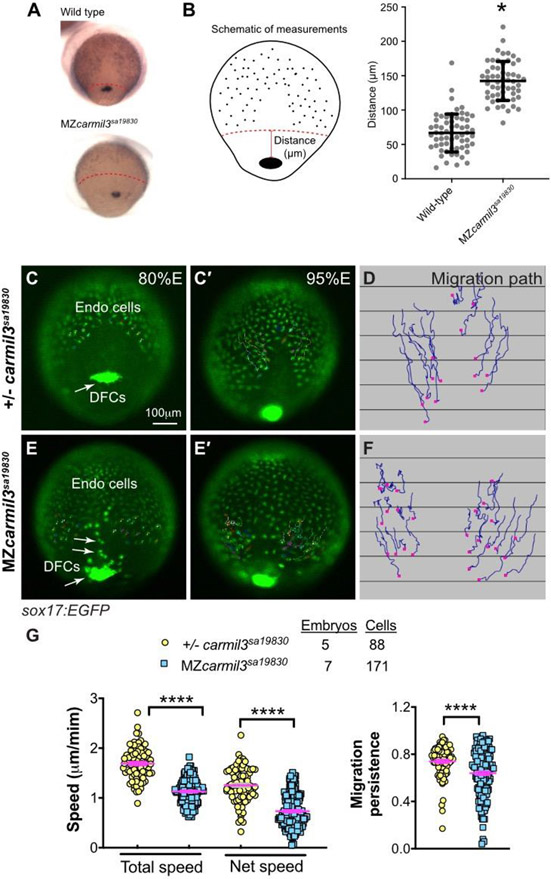
Figure 2.
Abnormal endodermal cell migration in carmil3 mutant embryos during gastrulation. (A) Representative images illustrating the patterns of sox17 expression in endodermal cells and DFCs detected by WISH in WT and MZcarmil3sa19830 mutant embryos. Red dotted line indicates the leading edge of the endoderm, used to measure migration distance. (B) Schematic diagram of zebrafish gastrula illustrating the distance of the leading edge of the migrating endoderm cells to DFCs. In the plot, each data point corresponds to one embryo. Values for the distributions were as follows (mean ± s.d.): WT 74 ± 25 (number of embryos, N=50), MZcarmil3sa19830 mutant 144 ± 28 (N=44). Asterisk (*) indicates p value of <0.0001 in Student’s t-test. Panels C through G are in vivo migration analysis of EGFP-labelled endodermal cells performed by epifluorescence time-lapse experiments on +/−-carmil3sa19830 or MZcarmil3sa19830 mutant embryos in the Tg(sox17:EGFP) background. (C, E) Snapshots at 80% epiboly stage from the time-lapse movie, with the tracked cells labeled. (C’, E') Snapshots at 95% epiboly stage, with the migration tracks of endodermal cells from the 80% to 95% epiboly stage superimposed. Scale bar: 100 μm. (D, F) Migration tracks delineate routes of endodermal cells. Solid magenta squares denote the endpoint of migration. (G) Total speeds, net speeds, and migration persistence. The number of embryos and cells analyzed is indicated above the graphs. Asterisks (****) indicate p value of <0.0001 in Student’s t-test.

