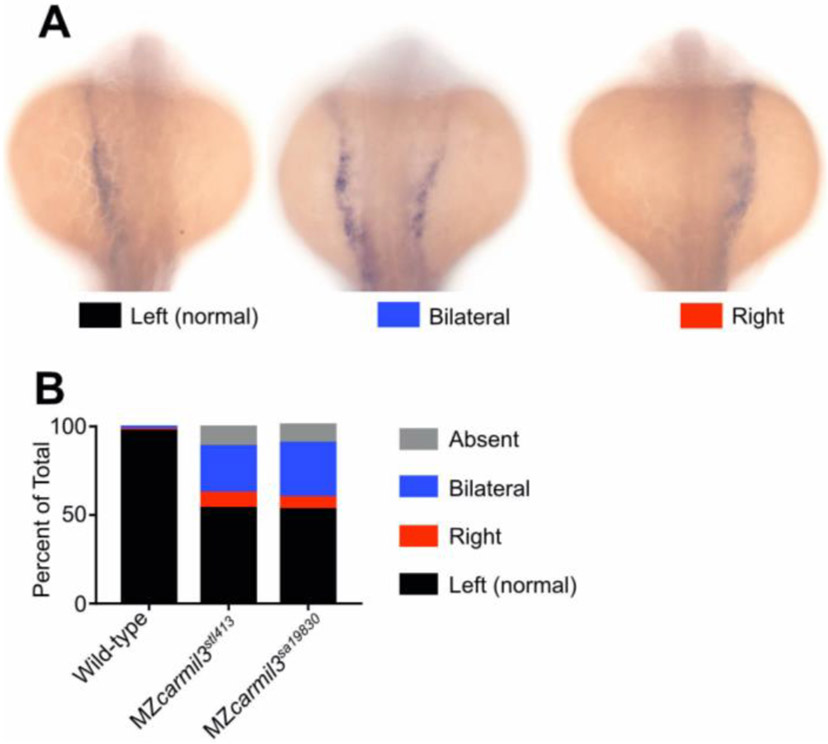
Figure 6.
Patterns of spaw staining distribution at the 18-20 somite stage in carmil3 mutant embryos compared with WT embryos. (A) Representative images illustrate observed patterns of spaw staining, which is purple. (B) Percentage of spaw staining patterns, comparing WT embryos with embryos of two different carmil3 alleles, MZcarmil3stl413 and MZcarmil3sa19830. The color scheme is indicated in panel A, below the images. In cases scored as “absent,” no staining was observed. Values are listed in Table I.

