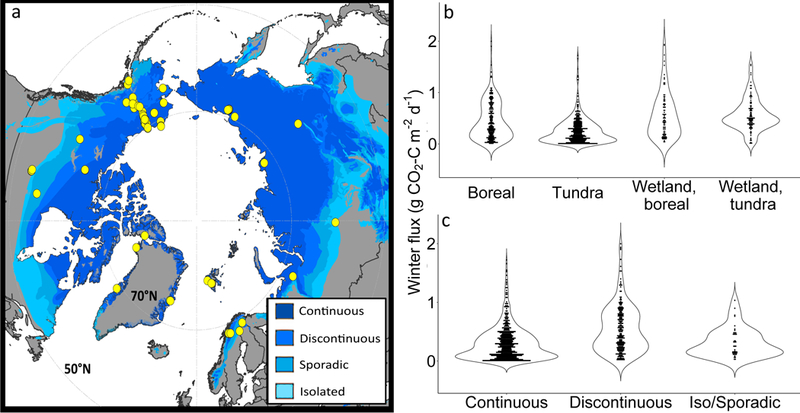
Fig. 1. Distribution of in situ data included in this winter CO2 flux synthesis.

(a) Locations of in situ winter CO2 flux data (yellow circles) in this synthesis include (b) upland and wetland sites in boreal and tundra biomes located (c) within the northern permafrost region41. Violin plots (b,c) depict magnitude and distribution density (width; dots are monthly aggregated data) of in situ data used in our machine-learning model.
