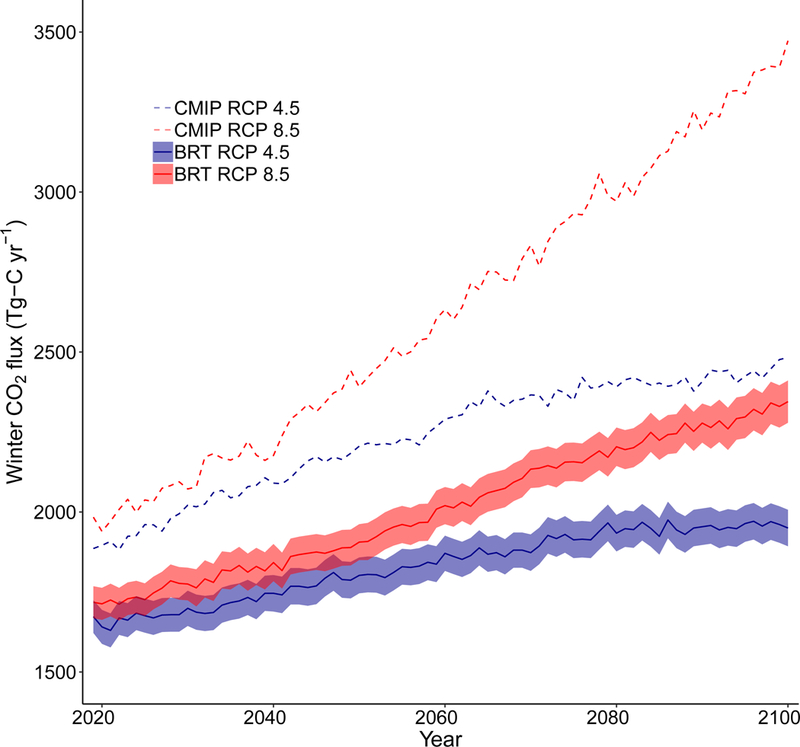
Fig. 4. Projected annual CO2 emissions during the winter for the northern permafrost region.

Solid lines represent BRT modeled results through 2100 under RCP 4.5 (blue solid line) and RCP 8.5 (red solid line), with bootstrapped 95% confidence intervals indicated by shading. For reference, CMIP5 ensemble respiration for RCP 4.5 and 8.5 are also shown (dashed lines).
