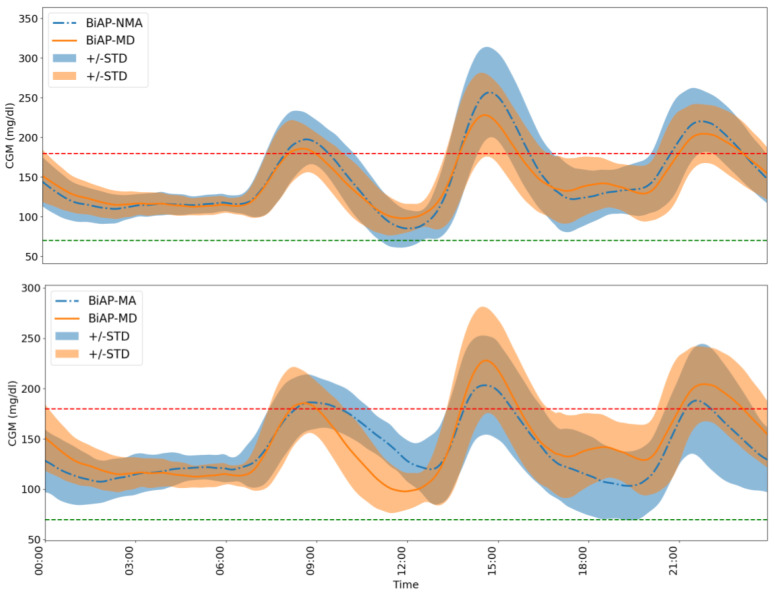
Figure 5.
A comparison of the 24 h glucose profile of Adult 3 from the virtual cohort over the 2-month period between the BiAP controller with meal detection and the two baseline configurations. The red and green lines mark the hyperglycaemia and hypoglycaemia threshold, respectively. (Top) BiAP-NMA vs. BiAP-MD:A comparison between the BiAP controller performance without and with the meal detection and estimation incorporated. (Bottom) BiAP-MA vs. BiAP-MD: A comparison between the BiAP controller performance with user-initiated meal announcement and automatic meal detection and estimation.

