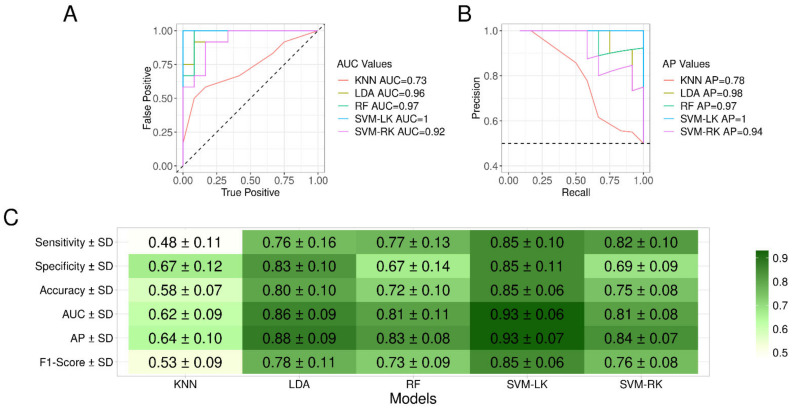
Figure 5.
Performances curves of the five machine learning models. Best AUC values for ROC (A) and best AP values for precision recall (B) curves associated to each model trained on samples from Cov+ (n = 51) and Cov− (n = 51) groups collected at D0 are presented. (C) Summary of performances obtained per ML model. F1-Score was used as a performance measure to select the most suitable developed model. AP: average precision; AUC: area under the curve; Cov+/−: MS spectra from individuals enrolled in the COVID-19 and control groups, respectively; K-NN: K-nearest neighbors; LDA: linear discriminant analysis; ML: machine learning; RF: random forest; SVM-LK: support vector machine with linear kernel; SVM-RK: support vector machine with radial kernel.

