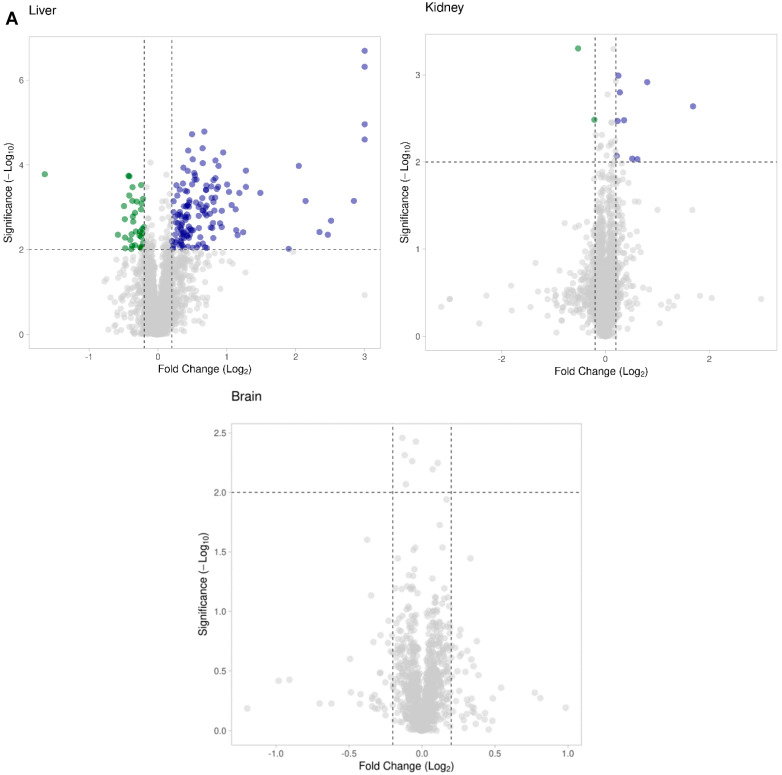
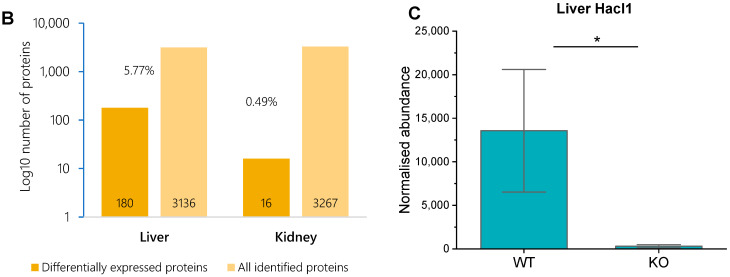
Figure 3.
Proteomic analysis of Hacl1−/− mouse tissue. (A) Scatter plot of proteins identified and their fold change in Hacl1−/− liver, kidney, and brain tissue compared to wild-type. Proteins with 1.5-fold change (p < 0.01) were chosen as significantly differentially regulated. (B) Percentage of differentially expressed proteins in Hacl1−/− liver and kidney. (C) Hacl1 peptide abundance in mouse liver (* indicates p < 0.01).


