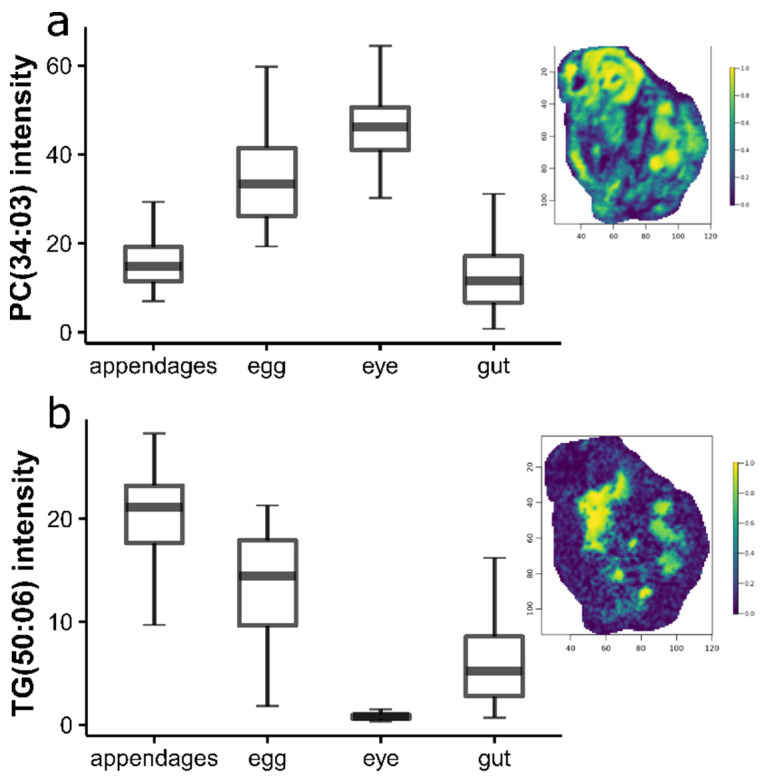
Figure 4.
Boxplots showing the differences in the abundance of a representative phosphatidylcholine and triacylglyceride; (a) PC(34:03) at m/z = 778.5347, and (b) TG(50:06) at m/z 861.6503, between Daphnia magna appendages (blue), eggs (yellow), eye (green), and gut (red) following DESI-MS analysis. The error bars represent a 95% confidence interval. The representative ion images are overlaid on each plot to visualize the distribution of each lipid across the whole animal. The colour scale indicates the relative abundance of each lipid.

