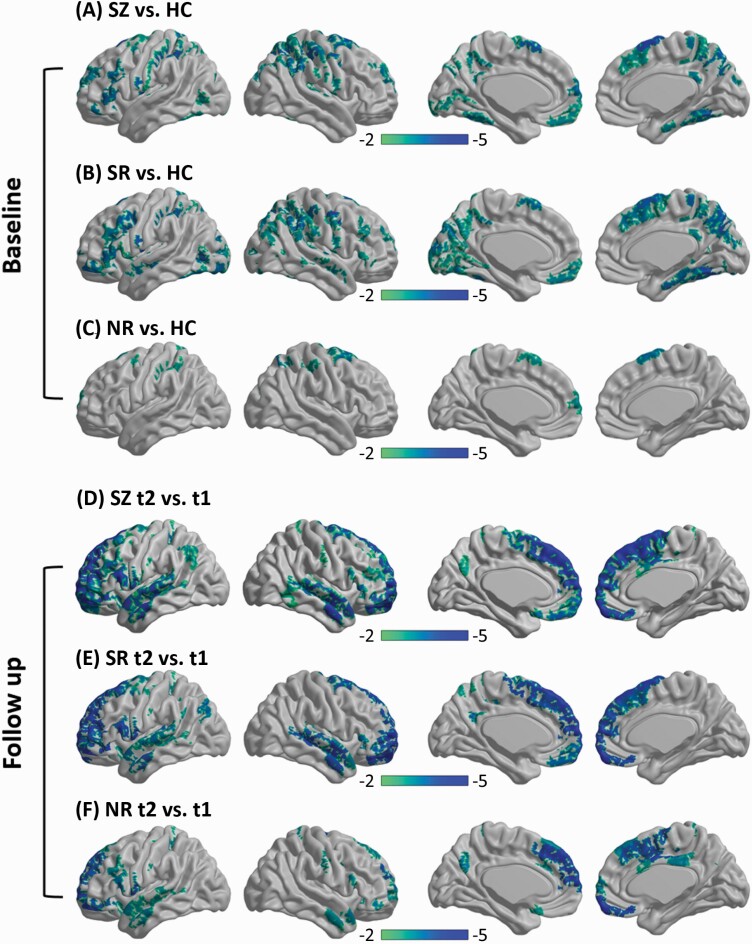
Fig. 1.
Cortical thickness comparisons. At baseline, thinner cortical thickness was shown in the 3 patient groups (A, all SZ patients; B, SR patients; C, NR patients) than in the HC group. At the follow-up (t2), cortical thickness reductions were observed in the patient groups (D, all SZ patents; E, SR patients; F, NR patients) compared with the baseline (t1). Regions for which the null hypothesis was rejected after controlling the FWE rate at 5% are shown in color maps. Color bar represents the t values. Note: FWE, familywise error; HC, healthy control; NR, nonresponder; SR, responder; SZ, schizophrenia.

