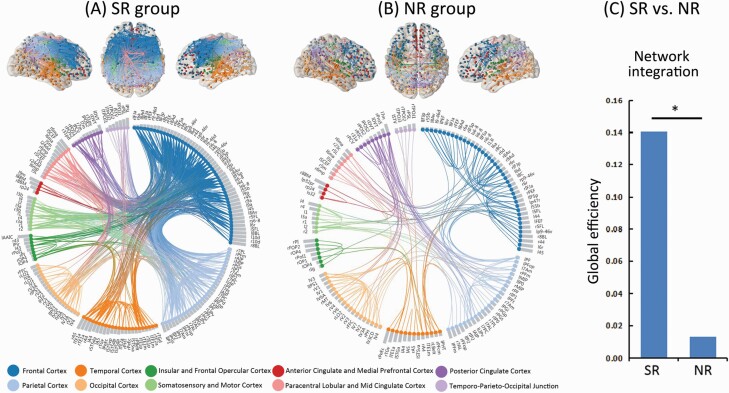
Fig. 2.
Cortico-cortical covariance based on the amount of cortical thickness thinning over the follow-up period is shown by brain connectivity maps and a circular connectogramb for the SR group (panel A) and NR group (panel B) after multiple comparison correction with the false discovery rate corrected, P < .000001. (C) The null hypothesis of equality in network integration between the SR and NR groups was rejected by the permutation test (*P < .05), indicating superior global efficiency in the SR group compared with the NR group. Note: NR, nonresponder; SR, responder. Brain regions are coloured on the brain connectivity maps according to cortex classifications (described below the circular connectogram). Brain regions are grouped on the circular connectogram according to cortex classifications (described below the circular connectogram). Within each subgroup, regions are ranked according to the severity of cortical thickness reductions at the follow-up, assessed by Cohen’s d effect size (ie, gray column adjacent to nodes). Brain connectivity maps and circular connectograms were produced by using NeuroMArVL (http://immersive.erc.monash.edu.au/neuromarvl).

