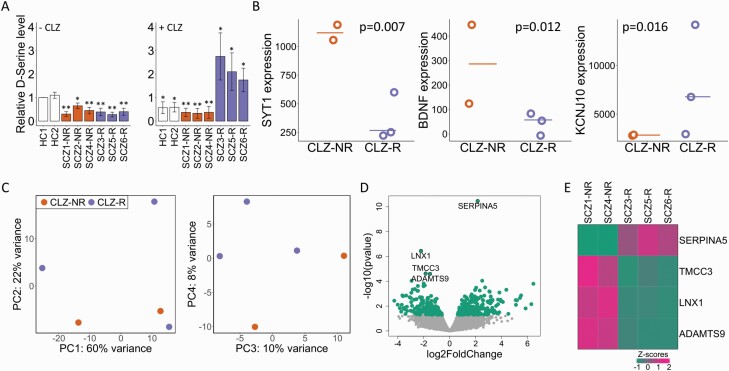
Fig. 3.
Potential role of subtype astrocytes in CLZ response. (A) Fold change of d-serine levels (measured as the number of d-serine-positive puncta) relative to HC1 before CLZ treatment. Left: Before CLZ treatment, Right: after CLZ treatment. The experiments were performed three times. Data shown as mean ± SD. Mann–Whitney U test: *P < .05 and **P < 0.01. (B) Expression levels of genes related to glutamate and d-serine metabolism and transport with nominally significant (P < .05) differences in CLZ-R vs. CLZ-NR samples. (C) PCA plots showing partial and complete clustering on CLZ response status across PCs 1–2 (left) and PCs 3–4 (right), respectively. The plots are based on the top 500 genes with largest expression variation across SCZ samples. (D) Global DE analysis between CLZ-R and CLZ-NR samples. Significant DE genes (FDR < 0.1) are labeled. (E) Heatmap of the four DE genes with differential expression in CLZ responders (R) compared to nonresponders (NR). Expression levels are shown as standardized z scores.

