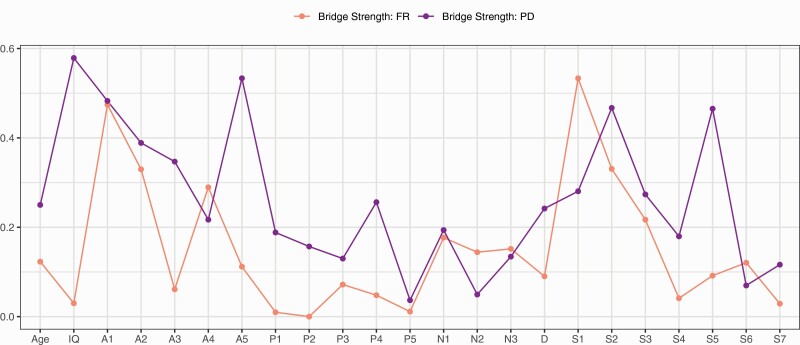
Fig. 3.
Bridge strength centrality for each node included in the network. The orange line indicates bridge strength centrality for the familial risk (FR) sample, while the purple line indicates bridge strength centrality for the psychotic disorder (PD) sample. For a color version, see this figure online.

