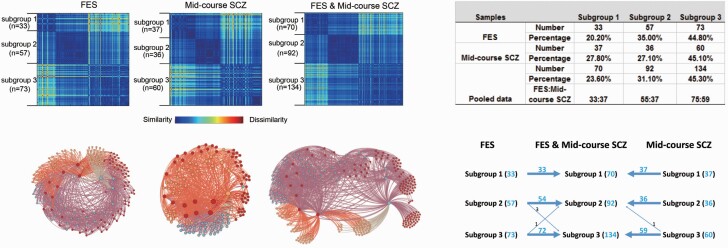
Fig. 2.
Clustering results. (left upper panel) Clustering results illustrated by dissimilarity matrices for treatment naïve first episode schizophrenia patients (FES), midcourse schizophrenia patients from Bipolar and Schizophrenia Network for Intermediate Phenotypes (B-SNIP) study and the combined sample. (left lower panel) Force-directed graph of patients with schizophrenia created using Gephi software (https://gephi.org/). The nodes colored differently denote the patients with schizophrenia belonging to different subgroups. Subtyping analysis revealed 3 subgroups of patients in FES, midcourse schizophrenia patients and the pooled analyses of these two samples of schizophrenia patients. (right upper panel) Clustering results showing the number and percentage of patients sorted into each of the three clusters in FES patients, midcourse schizophrenia patients and the combined samples. (right lower panel) Individuals in subgroups 1–3 in both patient samples were sorted into the same respective subgroup (1–3) in the pooled group solution with the exception of only 5 of 296 patients shifting between subgroups 2 and 3 relative to their grouping in the single patient group analyses.

