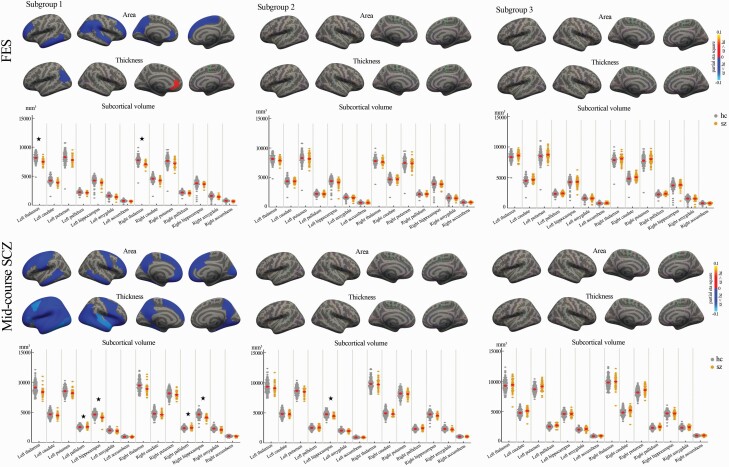
Fig. 3.
Cortical/subcortical structural alterations in the three subgroups of FES and midcourse schizophrenia patients compared with healthy controls (red color: increased cortical measure in patients; blue color: decreased cortical measure in patients; asterisk * represents a significant group difference with FDR correction).

