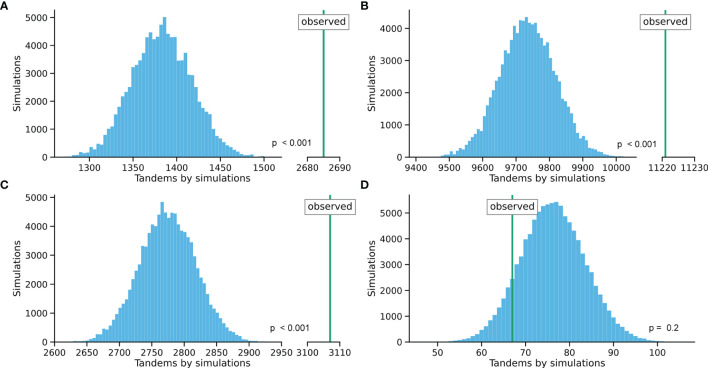
Figure 1.
Comparison between the tandems found in the simulated datasets (distribution of 100,000 simulations) and observed values for each cohort. (A) Leiden healthy cohort (IGHV). (B) Rotterdam healthy cohort (IGHV). (C) Rotterdam MSH2/6 deficiency cohort (IGHV). (D) Rotterdam UNG deficiency cohort (IGHV). The distance between the distribution and the observed value indicates the number of tandem mutations after correction. Z-score analysis was performed to compare distributions.

