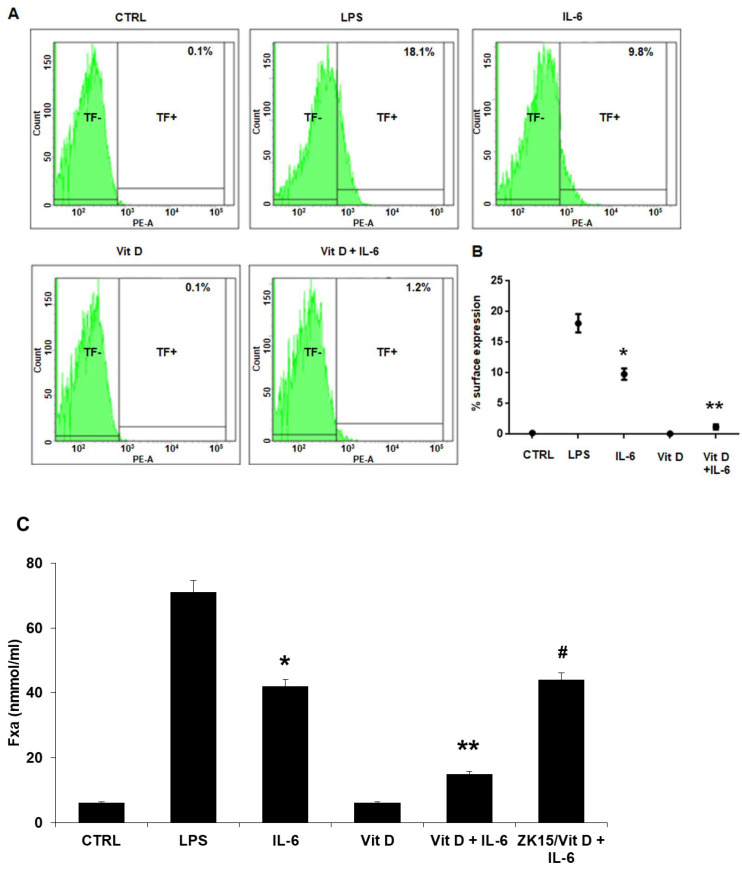
Figure 2.
(A) FACS analysis showed that IL-6 induced TF expression on cell surface. In controls (CTRL) and in cells cultivated with VitD alone, TF was almost not detectable on membranes (0.1%). Stimulation with IL-6 caused TF+ in 9.8 ± 1.8% of cells. In IL-6-treated cells preincubated with VitD, TF+ cells were reduced to 1.2 ± 0.8%. LPS served as positive control. (B) Graph of FACS analysis experiment. Each point represents the mean ± SD of 6 experiments. (up to 18% TF+ cells; * p < 0.001 vs. Control; ** p < 0.001 vs. IL-6 with Tukey’s post hoc test). (C) Effects of VitD on IL-6-induced TF activity evaluated by a two-step colorimetric assay based on the ability of TF/FVIIa to promote generation of coagulation FXa. IL-6-induced-TF activity reflects results observed for TF expression, confirming that TF was functionally active. VitD preincubation significantly reduces TF activity. The use of ZK15 abolished the VitD effect. LPS served as positive control. Each column represents the mean ± SD of 6 experiments in triplicate (* p < 0.001 vs. Control; ** p < 0.001 vs. IL-6, # p = NS vs. IL-6; one-way ANOVA with Tukey’s post hoc test).

