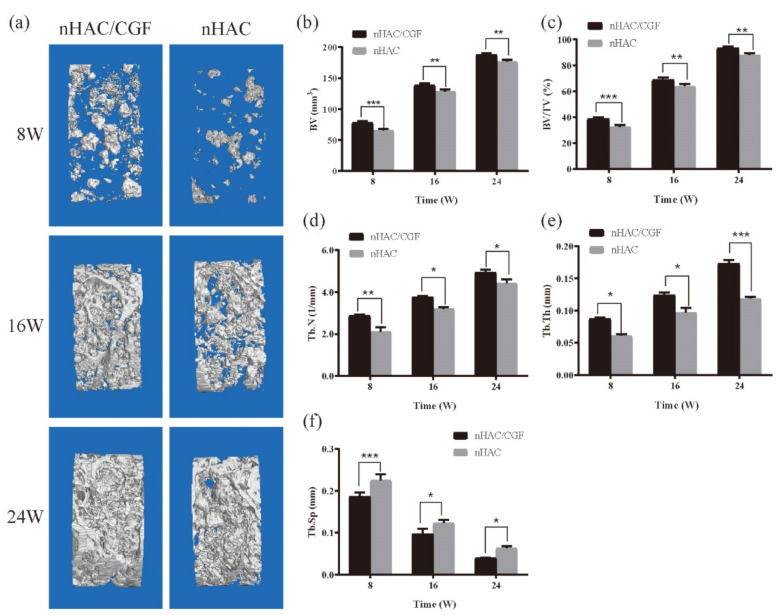
Figure 6.
New bone formation in vivo. (a) Representative 3D micro-CT images within the ROI at 8, 16, and 24 weeks after surgery. (b–f) Quantitative analysis of micro-CT of the new bone in the ROI.: (b) BV; (c) BV/TV; (d) Tb.N; (e) Tb.Th; (f) Tb.Sp. n = 3 in each group; * p < 0.05, ** p < 0.01, *** p < 0.001.

