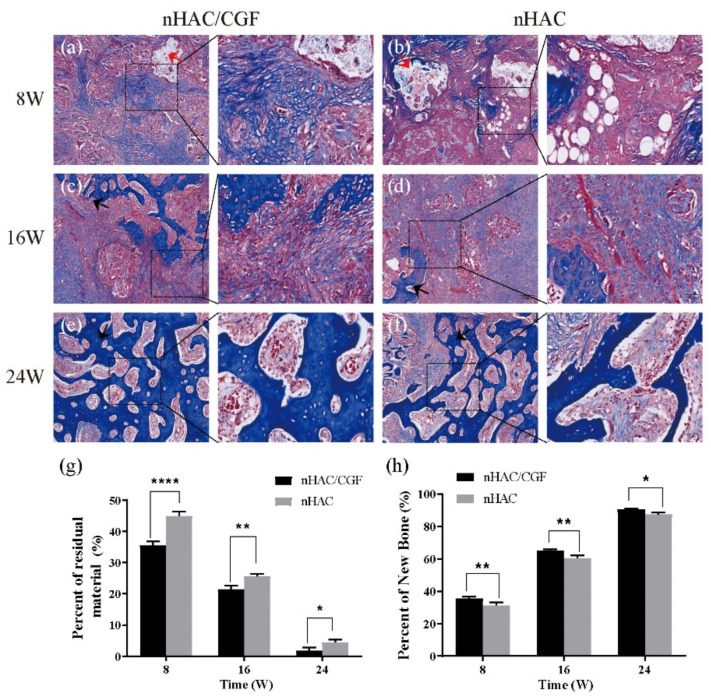
Figure 8.
Qualitative analysis of Masson staining. (a–f) New bone formation and material degradation in the defect area at 8, 16 and 24 weeks after implantation of the nHAC/CGF mixture and the nHAC alone. n = 3 in each group. (g,h) Quantitative analysis results of the percentage of new bone formed in the defect area and the percentage of material remaining. n = 3 in each group; * p < 0.05, ** p < 0.01, **** p < 0.0001. Red arrow: material; black arrow: new bone.

