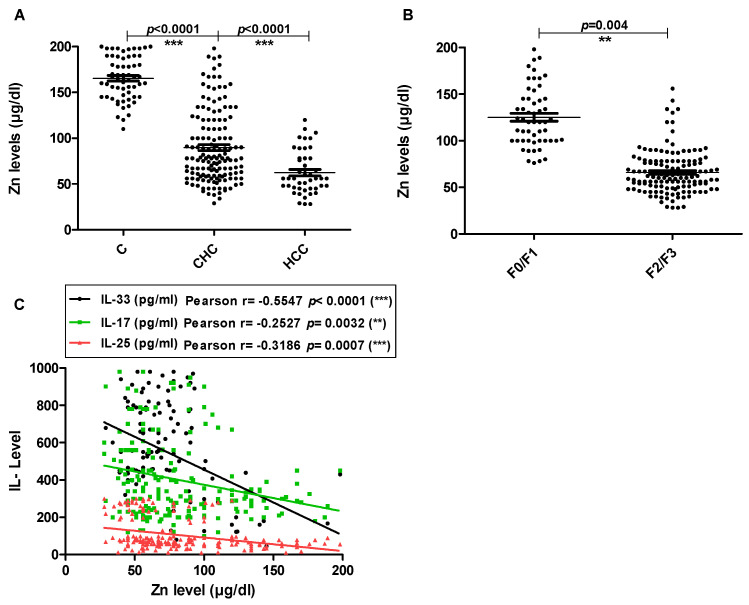
Figure 5.
The Zinc levels in the serum. Data are presented as the mean values of individual participants from three separate experiments. The horizontal lines refer to the median values of different groups. (A) The basal levels of zinc in serum of CHC, HCC and C groups. (B) the levels of serum zinc of CHC and HCC patients with different fibrosis scores. (C) The correlation between the levels of serum interleukins and zinc level. C: healthy controls, CHC: patients with chronic hepatitis C and HCC: patients with hepatocellular carcinoma.

