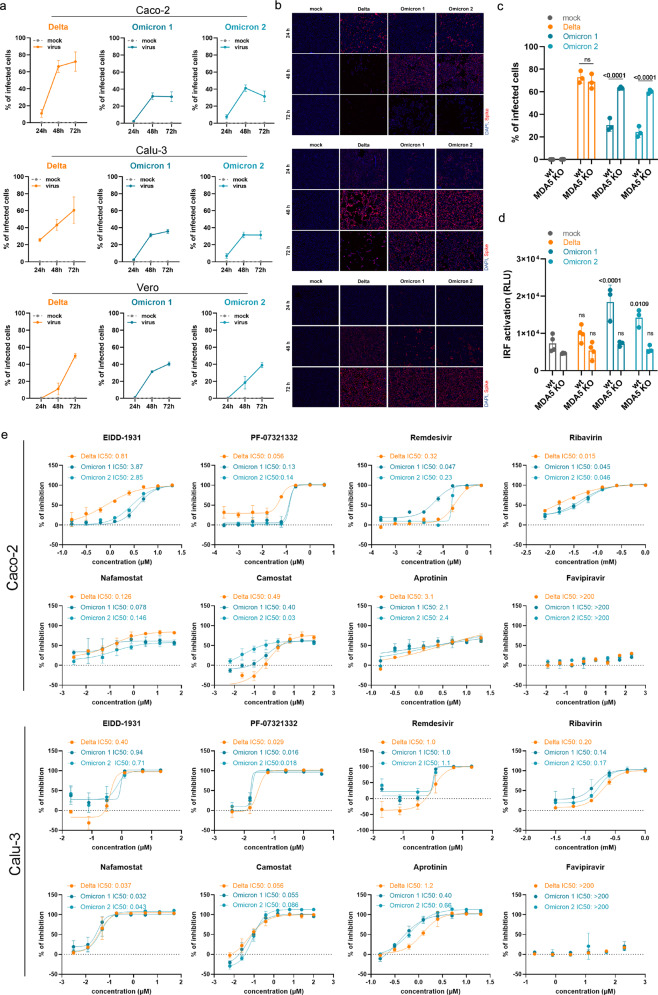
Fig. 1. Interferon antagonism and antiviral therapy against novel SARS-CoV-2 variant Omicron.
a Caco-2 and Calu-3 cells were infected with SARS-CoV-2 variant Delta (GenBank ID: MZ315141), Omicron 1 (GenBank ID: OL800702) and Omicron 2 (GenBank ID: OL800703) at an MOI of 0.01. The number of infected cells at different time points post infection was determined by immunofluorescence staining of the SARS-CoV-2 S protein. Graphs represent means ± SD of 12 biological replicates. b Representative immunofluorescence images of a are shown (4× magnification). c Virus infection rates in A549-ACE2/TMPRSS2 MDA5-WT (wt) and A549-ACE2/TMPRSS2 MDA5 KO (MDA5 KO) cells 72 h post infection as determined by immunofluorescence staining of the S protein. Graph represents data of four biological replicates. d Induction of IRF transcriptional activity 24 h post infection in a promotor reporter assay. Graph displays means ± SD of four biological replicates. e Dose-dependent effects of selected antiviral compounds on SARS-CoV-2 Omicron and Delta variant isolates. Compounds were added to confluent monolayers and cells were subsequently infected with viral variants at MOI of 0.01. The inhibition rate was evaluated 24 h (Caco-2) and 48 h (Calu-3) post infection by staining of the S protein. Graphs depict means ± SD of three biological replicates. P-values were calculated using two-way ANOVA (c, d). ns, not significant.

