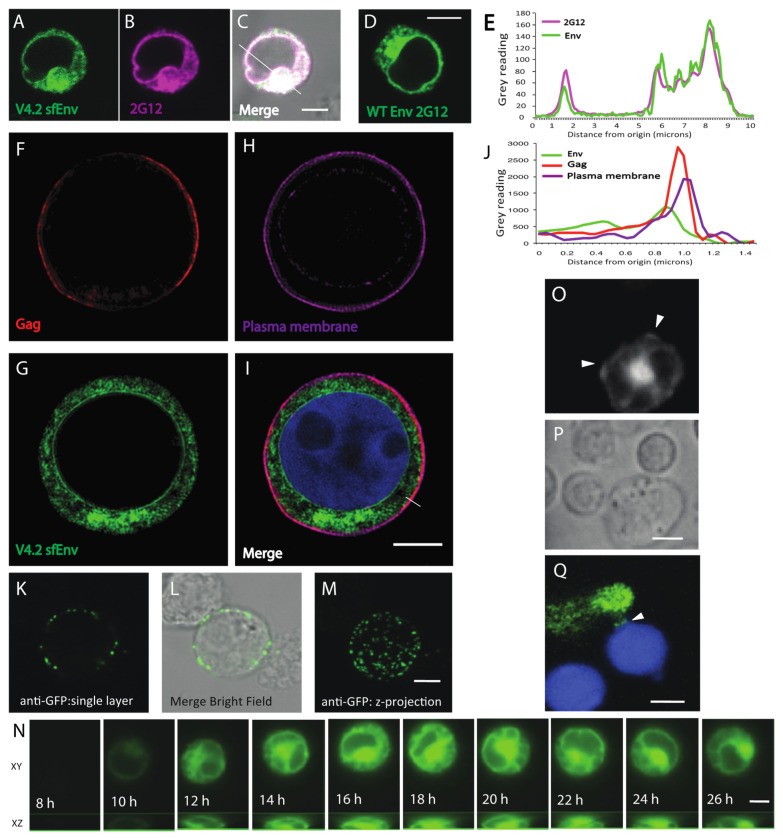
Figure 2.
Fluorescence microscopy showing cellular distribution of sfGFP-tagged Env in Jurkat cells. (A–D) Confocal fluorescence microscopy of Jurkat cells transfected with HIV Env V4.2-Gag-iCherry were fixed and stained with anti-Env mAb 2G12 (Magenta). (A) V4.2 sfGFP Env localization, (B) 2G12 Env immunostaining, (C) Merged image with bright field overlay. (D) Confocal microscopy image of WT NL4-3 Env stained with anti-Env mAb 2G12 (Green). (E) Graph shows the fluorescence intensity of Env and 2G12 staining traced along the line indicated in (C). (F–I) Super resolution structured illumination imaging of Jurkat cell nucleofected with HIV V4.2-Gag-iCherry were stained with cell mask deep red. (F) Cherry-Gag; (G), sfGFP-Env, (H) Cell Mask; (I), Merged image plus nuclear DAPI stain (blue). (J) Graph shows the fluorescence intensity of Gag, Env and plasma membrane along the line as indicated in (I). (K–M) Cell surface Env was stained with anti-GFP followed by secondary antibody while cells were alive at 4 °C. The cells were then imaged for surface anti-GFP Env staining, (K) single confocal plane; (L) single plans merged with bright field; (M) Z-projection of stack. (N) Example of an HIV V4.2 sfGFP Env nucleofected Jurkat cell was imaged in an Ibidi microchamber slide for over 26 h. Confocal z stacks were acquired at 10-min intervals from 6 h post transfection for 20 h. (O) Env-sfGFP fluorescence at site where target cells make contact with a donor Jurkat cell (arrow head-putative synapse). (P) Bright field view of (O) shows outline of the donor and target cells. (Q) Env accumulation at a putative VS formed between an infected primary CD4 T and a target primary CD4 T cell labelled with CellTracker Blue (Blue). Bar: 5 µm.

