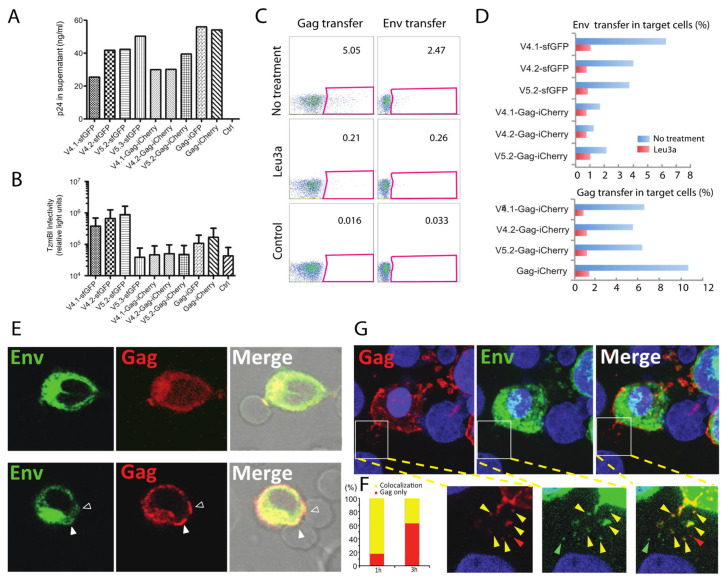
Figure 3.
Cell-to-cell HIV-1 transfer assays using dual fluorescent construct of V4/V5-Gag-iCherry. (A) Dual fluorescent HIV-1 constructs produce viral particles in 293 T cells as measured by p24 ELISA. Representative example of several transfection experiments is shown. “Ctrl” represents mock-transfected supernatants. In previous studies, HIV-Gag-iGFP and HIV Gag-iCherry produce ~50% WT HIVNL4-3 levels of p24 [46]. (B) Infectivity of these dual fluorescent HIV-1 constructs using Tzm-bl assay shows infectivity of single fluorescent Env constructs and lack of infectivity of viruses carrying chimeric Gag-iCherry or Gag-iGFP. (C) Dual fluorescent constructs HIV-1 V4.2-Gag-iCherry participates in cell-to-cell transfer of HIV from Jurkat to primary CD4 T cells. Flow cytometry measures transfer of Gag-iCherry and Env V4.2-sfGFP signal following cell–cell co-culture, and the transfer is sensitive to CD4 antibody leu3a. Control condition shows background fluorescence of target cells alone. (D) Cell-to-cell HIV-1 transfer of Gag and Env measured with indicated fluorescent HIV-1 constructs. (E) HIV-1 VS between HIV V4.2-Gag-iCherry transfected Jurkat cells and primary CD4 T cells. Primary CD4 cells from healthy human peripheral blood were co-cultured with transfected donor cells for 3 h. Upper panel: A synaptic button with both Gag and Env is shown between a donor Jurkat cell and a target cell. Lower panel: one donor cell nucleofected with V4.2-Gag-iCherry formed two VSs: the lower synapse shows both Env and Gag concentrated at the cell–cell contact site, while the upper synapse shows Gag accumulation without Env accumulation. (F) Analysis of Env and Gag colocalization at virological synapses. Samples fixed at 1 h post co-culture and 3 h post co-culture were compared. VSs, n = 17 at 1 h and n = 24 at 3 h, counted from 6 fields of view were defined by Gag at the site of cell–cell contact and categorized by reviewers blinded to time point, to enumerate whether Env was colocalized at cell–cell contact site (yellow) or whether Gag was present without Env (red). (G) Transfer of both Gag and Env into target cells. Co-cultured cells were fixed and observed by confocal microscopy. Inset shows partial colocalization of transferred Gag and Env. Green, red and yellow arrowheads show Env only, Gag only transfer or co-transfer of both Gag and Env. Bar: 5 µm.

