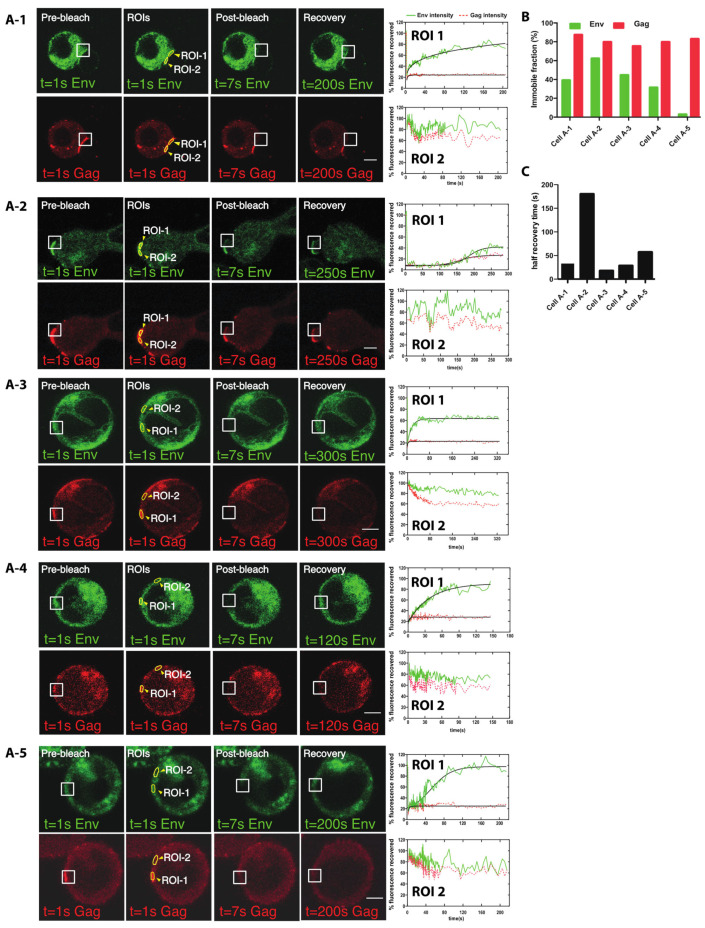
Figure 5.
Rapid Env fluorescence recovery after photobleaching was observed at the VS. CD4+ T cell line Jurkat was nucleofected with HIV Env V4.2 sfGFP-Gag-iCherry and mixed with primary CD4 T cells and allowed to form VSs. Established synapses where Gag and some level of Env was observed at cell–cell contacts were selected for FRAP imaging. (A-1–A-5) Before photobleaching (left panels) a virological synapse with both Gag and Env could be observed between a donor cell and a target cell. A region covering part of the synaptic junction is bleached as marked by the white square. After photobleaching, fluorescent recovery measured in Env and Gag in selected regions of interest (ROI). ROIs were selected on bleached synapse or an unbleached area as shown in closed yellow region. A fluorescence intensity curve describing the fluorescence recovery is shown (left). (B) Immobile fraction of each FRAP experiment is indicated. (C) Graph shows the t half recovery time of each cell (A-1–A-5). Bar: 3 µm.

