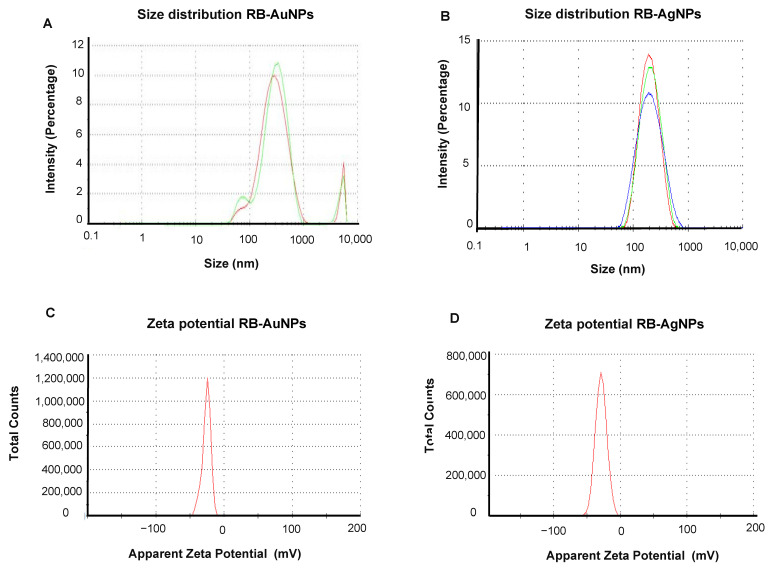
Figure 4.
Dynamic light scattering analysis of RB-AuNPs and RB-AgNPs. (A) RB-AuNPs distribution concerning size and intensity (B) RB-AgNPs distribution concerning size and intensity. Different color represents technical replicates. (C) Zeta potential of RB-AuNPs and (D) RB-AgNPs, representing highly negative surface charge.

