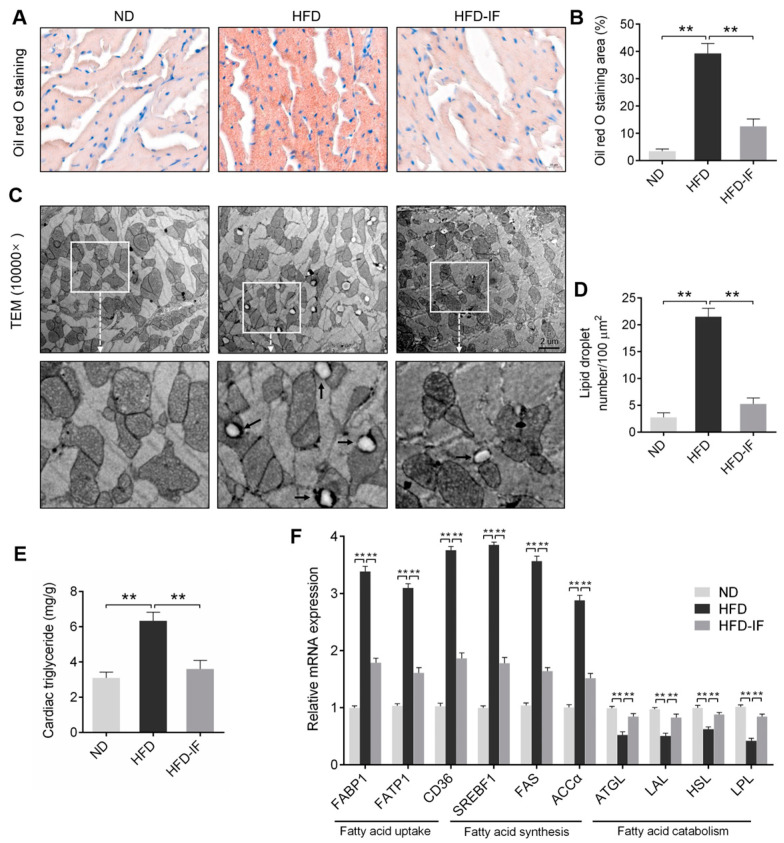
Figure 4.
IF improves cardiac lipid deposition in HFD-fed mice. (A) Representative images and (B) quantitative analysis of Oil Red O staining heart sections. Scale bar = 20 μm. (C) LDs were observed by TEM at 10,000× magnification. Scale bar = 2 μm. The lower image is an amplification of the upper white box. LDs were marked with black arrows. (D) Quantitative analysis of TEM at 10,000×. (E) Levels of TG in heart of mice. (F) RT-PCR analysis of the mRNA expression of genes regulating fatty acid uptake (FABP1, FATP1, and CD36), fatty acid synthesis (SREBF1, FAS, and ACCα), and fatty acid catabolism (ATGL, LAL, HSL, and LPL) in cardiac tissues. Data are shown as means ± SEM. ** p < 0.01.

