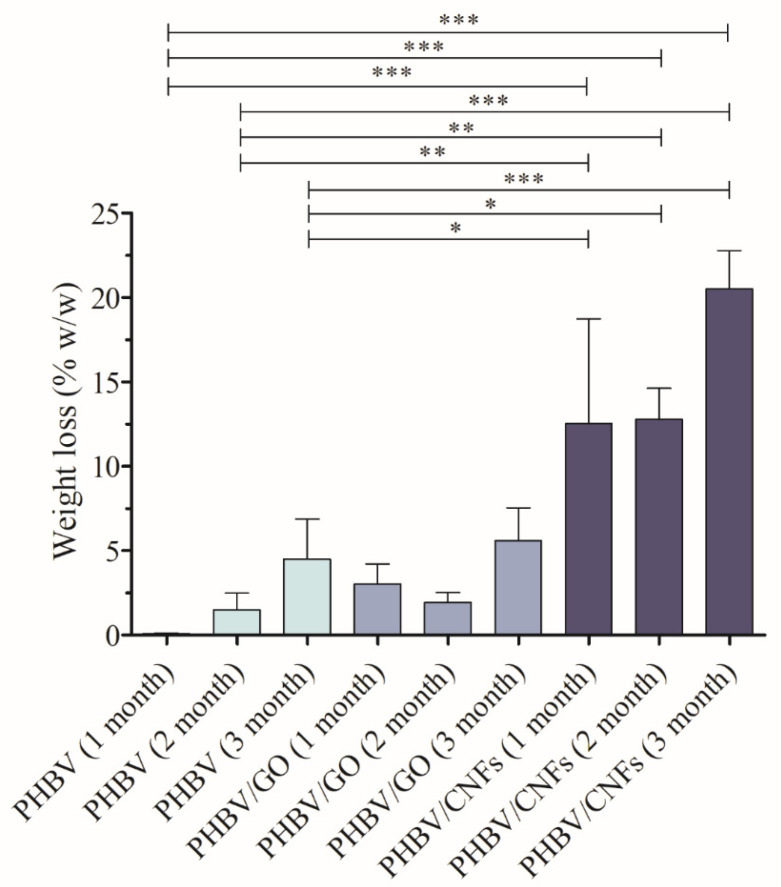
Figure 2.
Weight loss of PHBV, PHBV/GO and PHBV/CNFs after degradation in acid aqueous medium (pH = 6) for 1, 2 and 3 months. Data are shown as mean ± standard deviation. Significant differences between samples were calculated by one-way ANOVA with Tukey’s correction. Only the significant differences are indicated in the graph with their level of significance: * p > 0.05; ** p > 0.01; *** p > 0.001.

