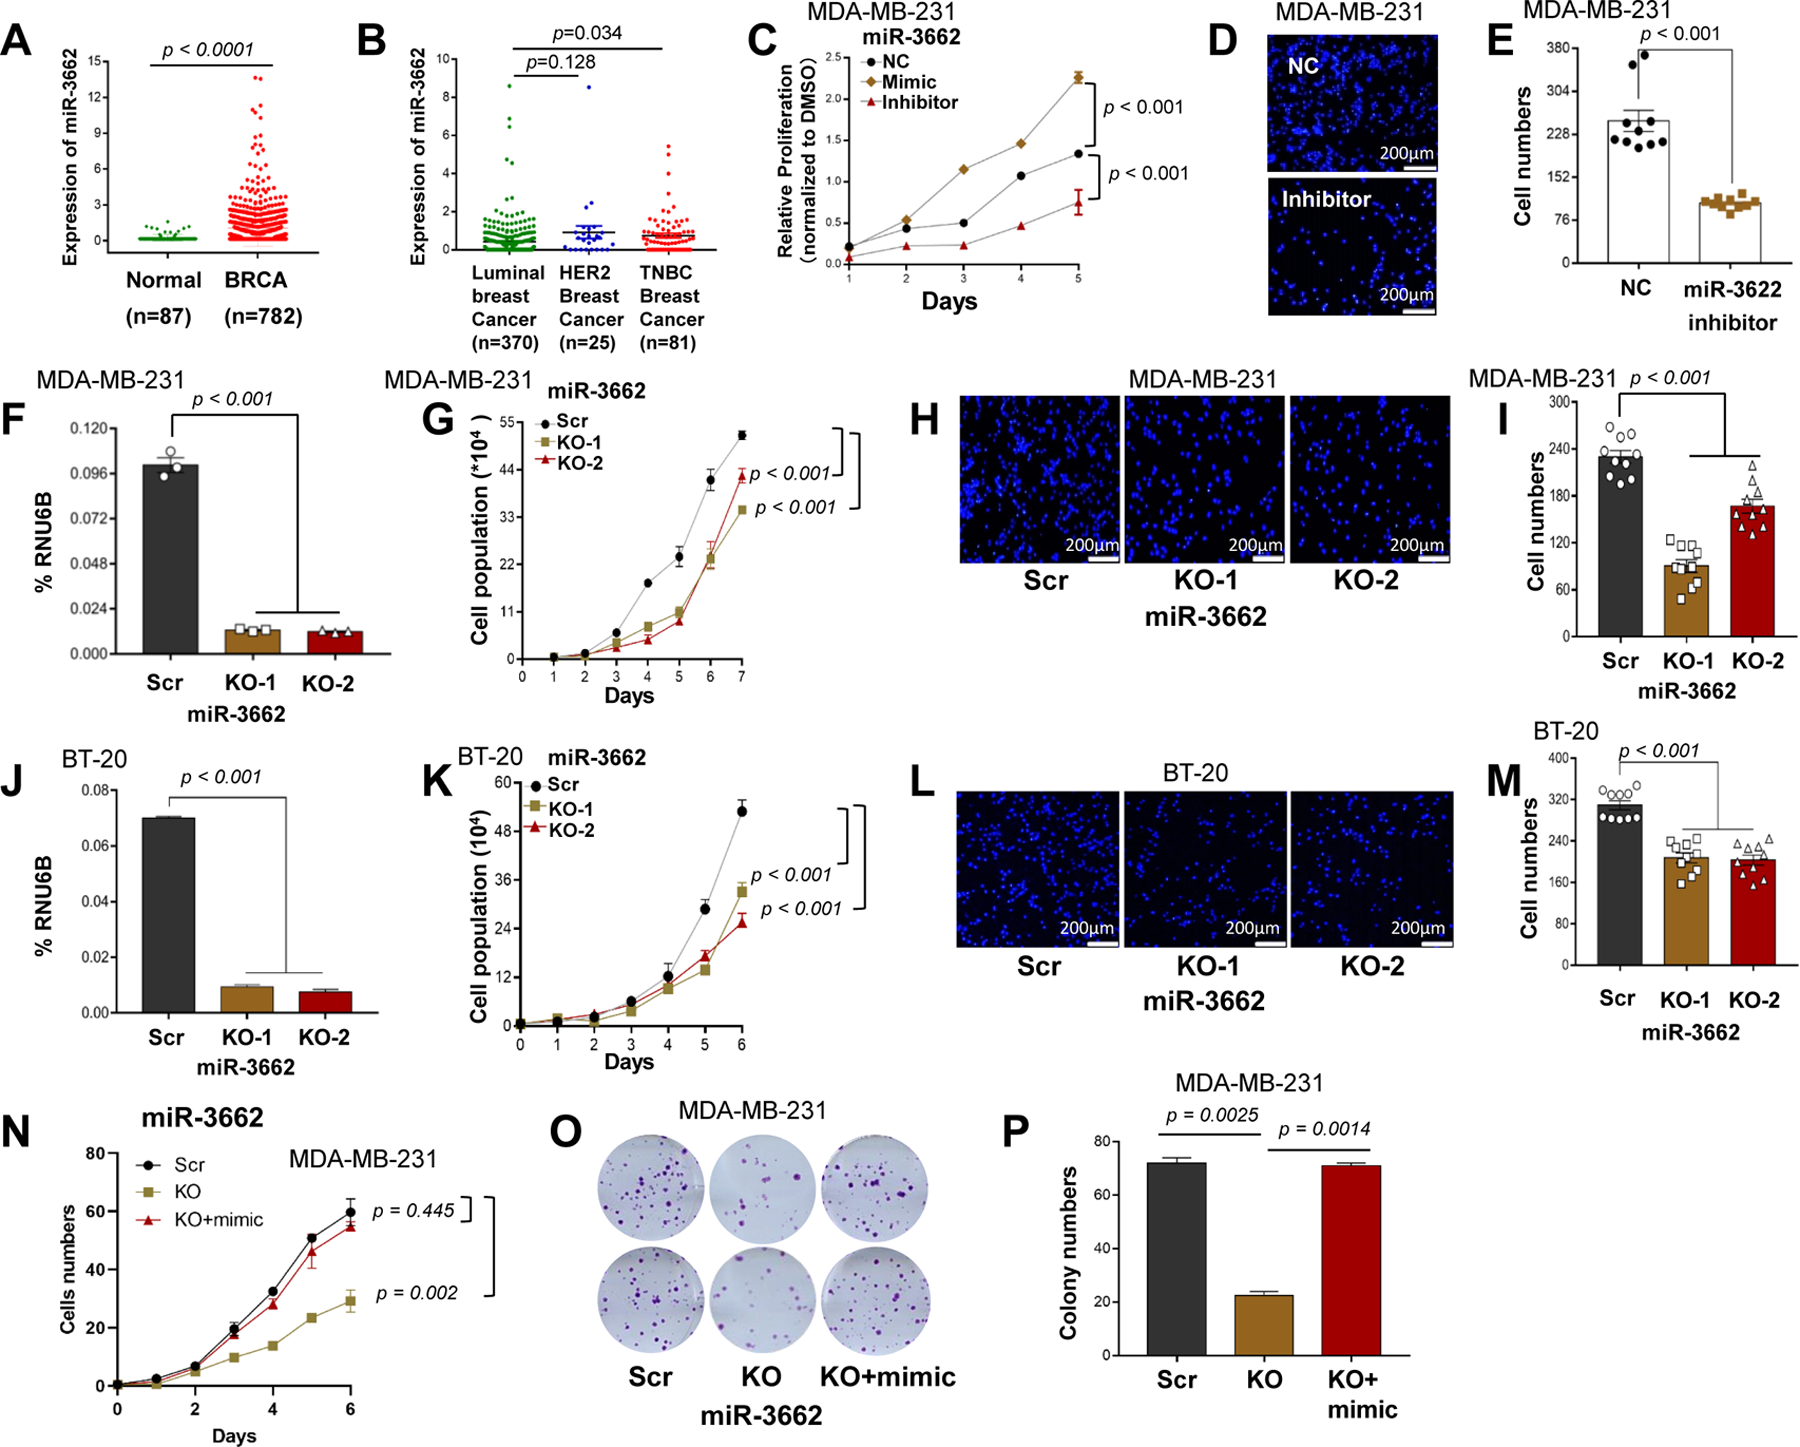
Figure 1. miR-3662 KO inhibited cell proliferation and migration of TNBC cells.

A. The normalized expression levels of miR-3662 in TCGA human primary breast cancers and normal breast tissues. B. Expression of miR-3662 in TCGA human triple-negative breast cancer (TNBC), HER2+ breast cancer, and luminal breast cancer tissues. C-E. Proliferation and migration determined by MTT assays and Transwell assays for MDA-MB-231 cells transfected with an miR-3662 mimic, inhibitor, or NC. F, J. Validation of miR-3662 KO in MDA-MB-231 and BT-20 cells by qPCR. G, K. Proliferation of miR-3662 scrambled control and KO cells for 6 days. H, L. Migration of scrambled control and KO cells for 24 hours as determined by Transwell assays. Images of 10 different 10× fields were captured from each membrane, and the numbers of migratory cells were counted by fluorescence microscopy. I, M. Quantification of rates of cell migration. N, O. Proliferation and colony formation of miR-3662 scrambled control, KO, and miR-3662 mimic-transfected KO cells for 6 days. P. Quantification of colony numbers. Data are presented as means ± standard deviation (SD). P values were determined by a two-tailed t-test or a two-way ANOVA test. NC, negative miRNA control; Scr, scrambled control; KO, knockout. All experiments were repeated three times.
