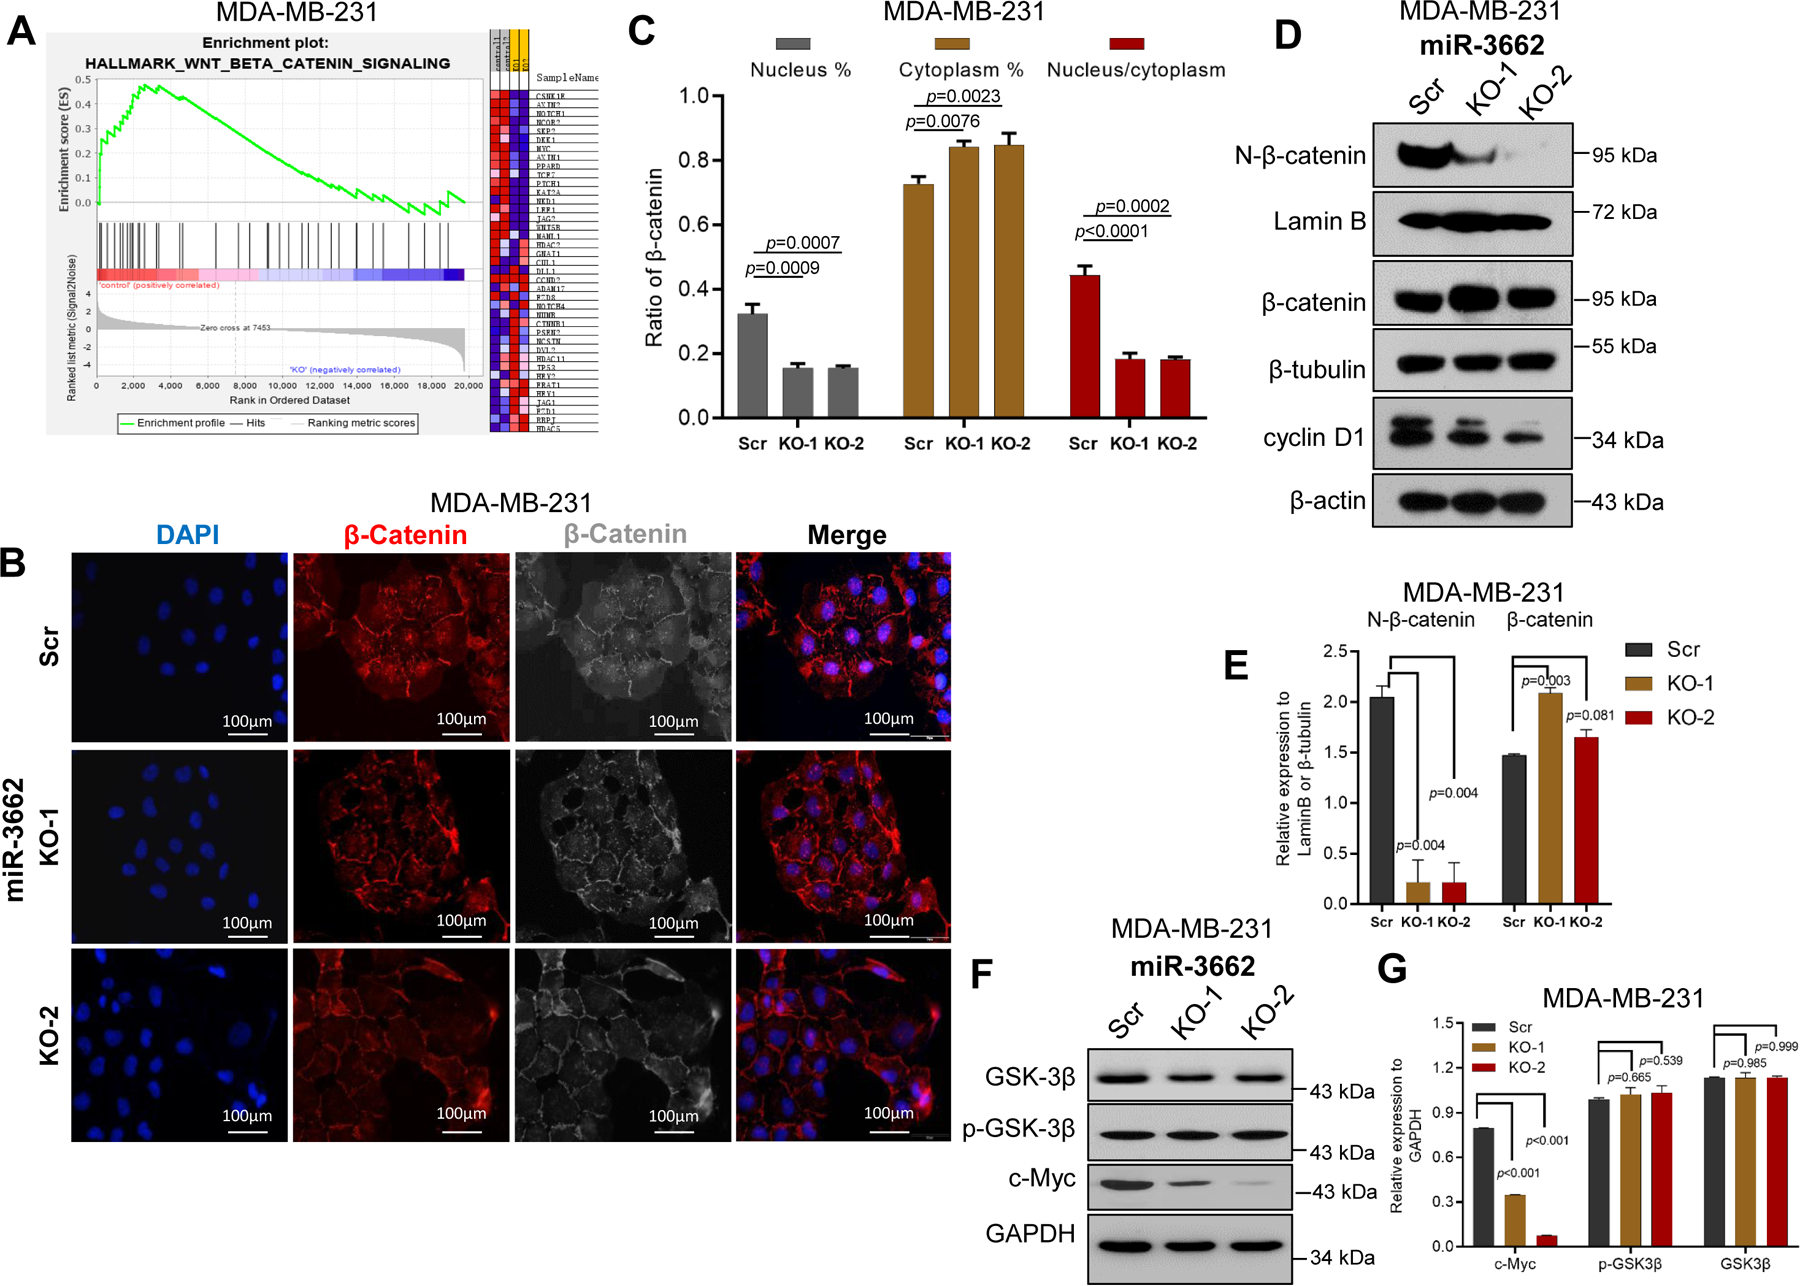
Figure 3. miR-3662 KO repressed the activation of Wnt/β-catenin signaling in MDA-MB-231 cells.

A. Enrichment of the WNT/β-catenin signaling pathway by GSEA analysis in miR-3662 scrambled control MDA-MB-231 cells compared to KO cells. B. Expression levels and nuclear localization of β-catenin by IF analysis in scrambled control and KO cells. C. Quantification of expression levels of nuclear/cytoplasmic β-catenin and their ratio. D, E. Expression levels of N-β-catenin, total β-catenin, and cyclin D1 in scrambled control and KO cells determined by Western blots. There were two bands in cyclin D1 protein expression. Based on cyclin D1 protein size, the lower band is cyclin D1, and the upper band is a non-specific band. F, G. Expression levels of total and phosphorylated GSK3β in scrambled control and KO cells determined by Western blots. Data are presented as means ± SD. P values were determined by a two-tailed t-test. GSEA, gene set enrichment analysis; IF, immunofluorescence; Scr, scrambled control; KO, knockout. All experiments were repeated three times.
