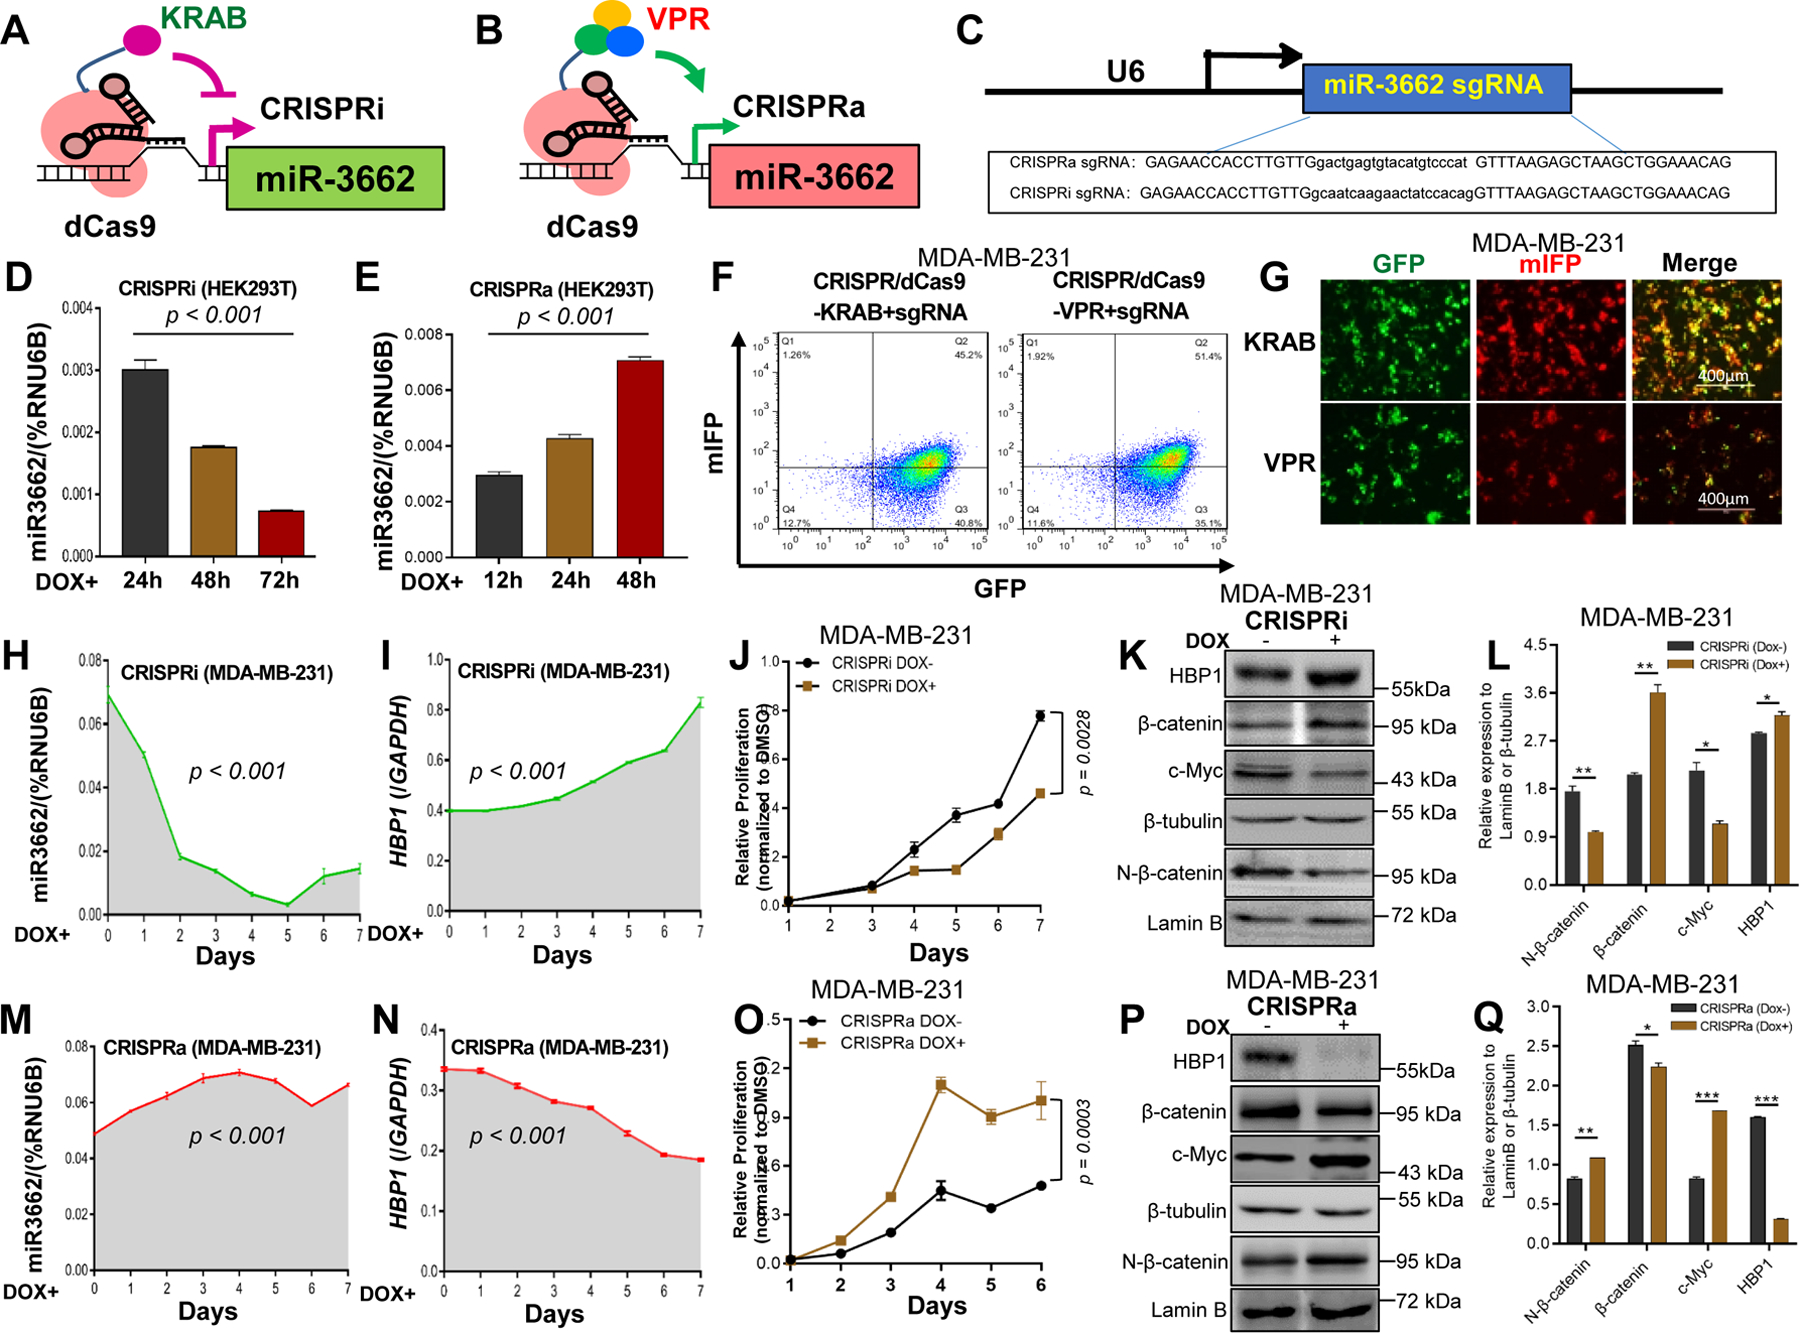
Figure 7. Regulation of the miR-3662-HBP1 axis and its effect on growth and the Wnt signaling pathway.

A, B. Schematic illustration of the CRISPRi/a system. C. Design and sequences for CRISPRi/a sgRNAs. D, E. Relative expression levels of mi-R3662 measured by qPCR in CRISPRi/a HEK293T cells after Dox induction (days 0–3). F, G. Expression of dCas9-KRAB, dCas9-VPR, and sgRNA determined by flow cytometric and IF analyses with GFP and mIFP in CRISPRi/a MDA-MB-231 cells. H, M. Expression changes of mi-R3662 in CRISPRi/a MDA-MB-231 cells after Dox induction (days 0–7) measured by qPCR. I, N. Expression changes of HBP1 in CRISPRi/a MDA-MB-231 cells after Dox induction (days 0–7) measured by qPCR. J, O. Changes of proliferation of CRISPRi/a MDA-MB-231 cells after Dox induction (days 1–7) assayed by MTT. K, L. Western blot and quantitative analyses of expression of HBP1 and Wnt signaling proteins in CRISPRi MDA-MB-231 cells before and after Dox induction (days 0 and 4). P, Q. Western blot and quantitative analyses of expression of HBP1 and Wnt signaling proteins in CRISPRa MDA-MB-231 cells before and after Dox induction (days 0 and 4). Data are presented as means ± SD. P values were determined by a two-tailed t-test or a one- or two-way ANOVA test. All experiments were repeated three times.
