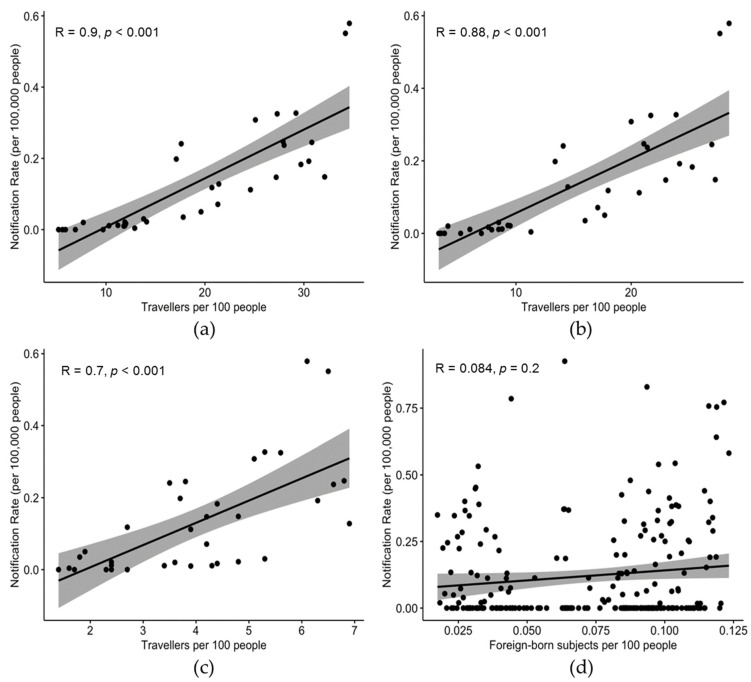
Figure 3.
Correlation between notification rates (per 100,000 people) by year or reporting (2014–2020), and: the share of travelers per 100 people by geographic area (i.e., north-western, north-eastern, central, and southern Italy, and main islands), in general (a); including only non-work-related travel (b); including only work-related travel (c); the share of foreign-born subjects per 100 people by year and reporting region (d).

