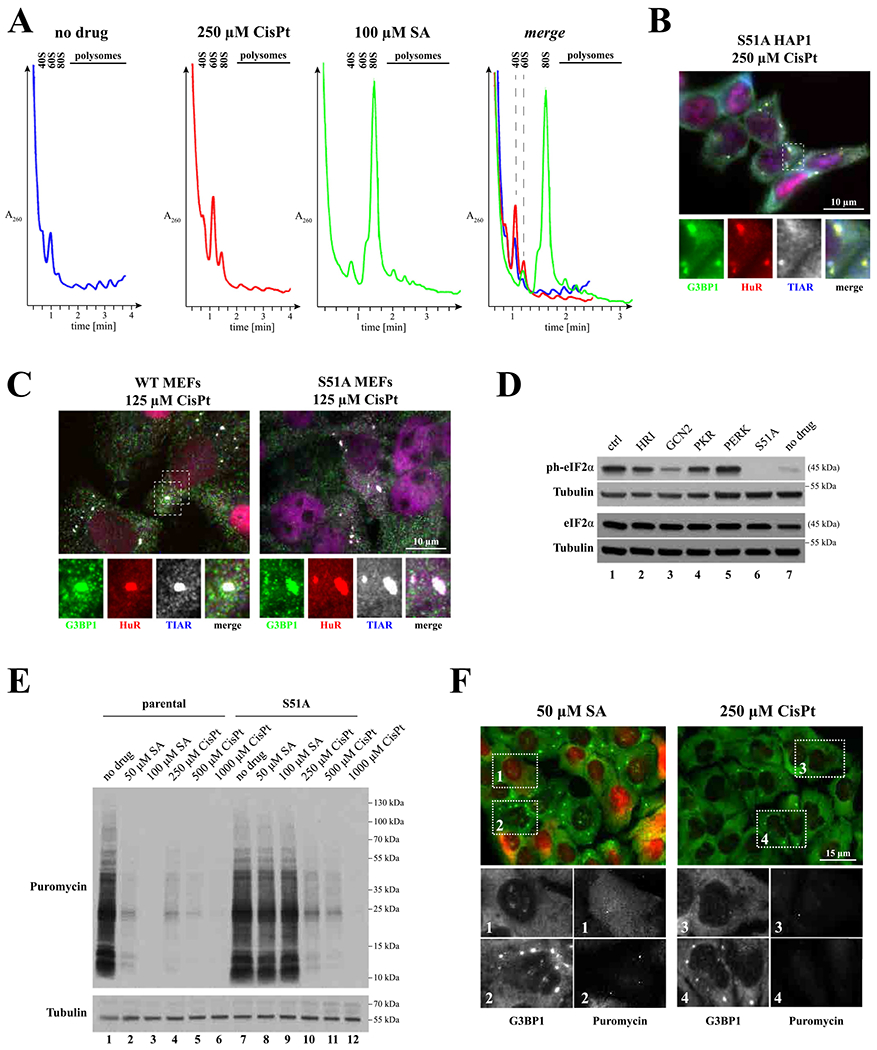
Fig. 6.

CisPt inhibits translation by promoting eIF2α phosphorylation. (A) Polysome profiles obtained from U2OS cells treated with cisplatin (CisPt, 250 μM) or sodium arsenite (SA, 100 μM) for 4 h and 1 h, respectively; as control, polysomes were isolated from untreated control cells (no drug). Polysome profiles lines were designated as follows: no drug – blue, 250 μM CisPt – red and 100 μM SA – green). (B-C) Formation of CisPt foci is independent of eIF2α phosphorylation. B: formation of CisPt foci in S51 HAP1 cells. C: formation of CisPt foci in WT and S51 mouse embryonic fibroblasts (MEFs). G3BP1, HuR and TIAR were used as markers. (D) Effect of CisPt on eIF2α phosphorylation. Parental HAP1 (ctrl), HAP1 variants with eIF2α kinase knockout genes (HRI, GCN2, PKR and PERK) or with eIF2α S51A mutation (S51A) were treated with CisPt (250 μM, 4 h). Untreated parental HAP1 cells (no drug) were used as controls. Lysates from treated and control cells were analyzed by western blotting using anti-phospho-eIF2α antibody (ph-eIF2α). Total eIF2α (eIF2α) and tubulin β (Tubulin) were used as loading controls. (E) Detection of translation activity in two HAP1 cells lines (parental, left part, and S51A, right part) treated with sodium arsenite (50 μM, 100 μM, SA), cisplatin (250 μM, 500 μM, 1000 μM, CisPt). No treated control (No drug) was used as control. U2OS cells were subjected to RiboPuromycylation to compare levels of basal translation. An anti-puromycin antibody (Puro) was used to visualize de novo synthesized proteins. Tubulin is a loading control. A representative image is shown (n = 3). (F) Detection of translation activity based on immunofluorescence technique. U2OS cells were treated with sodium arsentite (SA, 50 μM) or cisplatin (CisPt, 250 μM), fixed and stained with G3BP1 (green) to detect CisPt foci and anti-puromycin to monitor translation (red, shown as grey in boxed sub-image). The size bar represents 10 μm.
