
Figure 4.
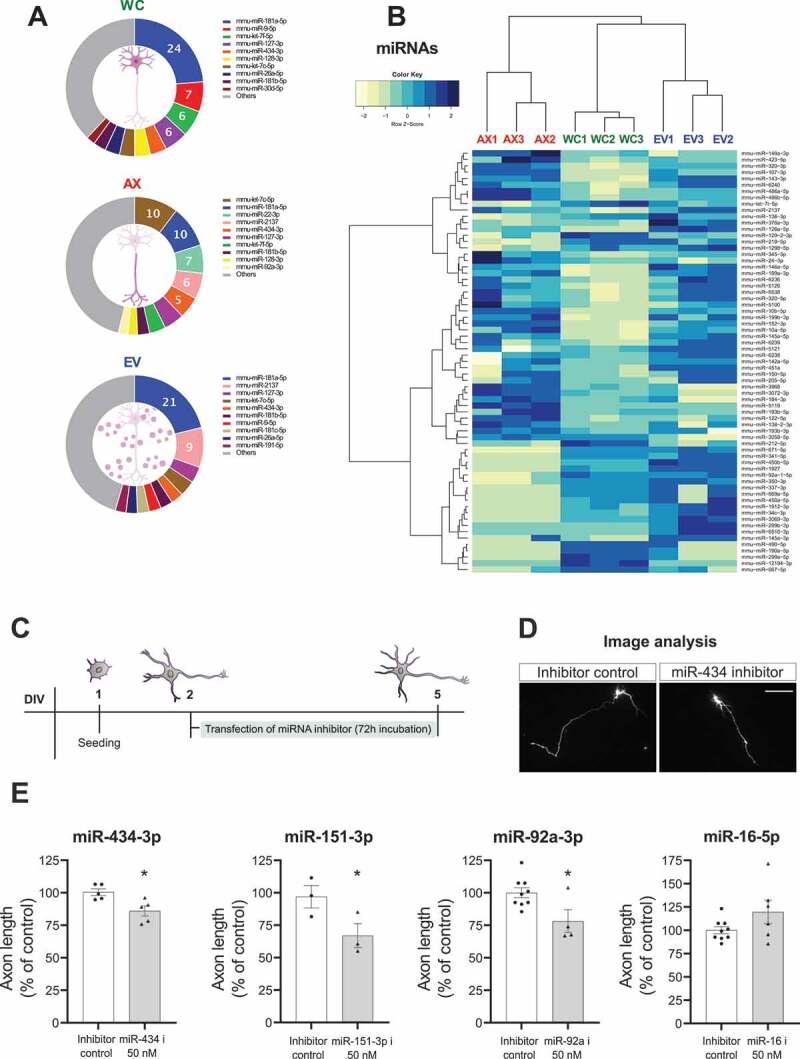
Characterization of miRNAs in neuronal subcellular and extracellular compartments and selective assessment of axonal growth effects. (A) Relative read abundance of miRNAs in WC, AX and EVs showing the most expressed miRNAs in each neuronal and EV compartment (percentage of the average normalized miRNA counts for each compartment). (C) Heatmap of the differential expression of miRNAs (67 DEGs, FDR ≤ 0.01 and absolute log2(FC) ≥ 1) for the different samples, shown as Z-score of log2 normalized counts (two-way hierarchical clustering distance measured by Euclidean and Ward clustering algorithms). Whole Cell (WC), Axon (AX) and Extracellular Vesicles (EV). (C) Overview of the experimental design for analysis of axonal outgrowth after inhibition of selected axonal miRNAs (D) Representative images of neurons measured after co-transfection with GFP and a specific miR-434-3p inhibitor or non-targeting control (scale bar: 100um). (E) Quantification of axon length in cortical neurons after specific inhibition of miR-434-3p, miR-151-3p and miR-92a showing a decrease in axon length, whereas inhibition of miR-16-5p results in an increase in length of cortical axons. Data presented as % of control expressed in mean±s.e.m, n = 3–6 independent experiments. Student’s t-test, *p-value <0.05.