
Figure 4.
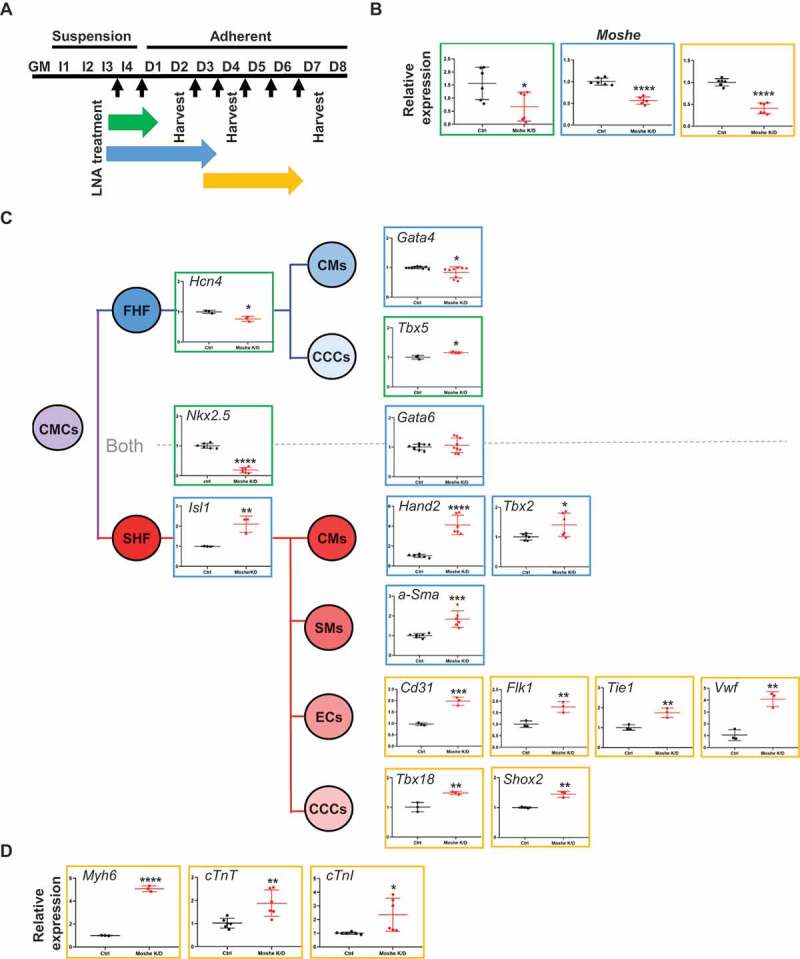
Knockdown of Moshe and altered heart-related gene expression. (A) Schematic diagram of Moshe knock-down in PC19 cells by the treatment of Moshe antisense LNA. Black arrow for LNA treatments. Three different stages are indicated: early cardiac progenitor stage (green), late cardiac progenitor (blue), and mature cardiomyocyte progenitor stage (yellow). (B) Depleted Moshe expression was measured by qRT-PCR. Colours indicate corresponding stages in (A). (C) Representative cardiac differentiation marker gene expressions under Moshe depletion is depicted in corresponding cell and SHF lineage is highlighted with the red line. CMCs: cardiac mesodermal cells, FHF: first heart field, SHF: second heart field, CMs: cardiomyocytes, CCC: cardiac conduction cells, SM: smooth muscle cells, and EC: endocardial cells. (D) Three marker gene expressions for mature cardiomyocytes. Data was analysed by student’s t-test. Error bars indicate SD. Asterisk indicates * p-value < 0.05, ** p-value < 0.01, *** p-value < 0.001, **** p-value < 0.0001