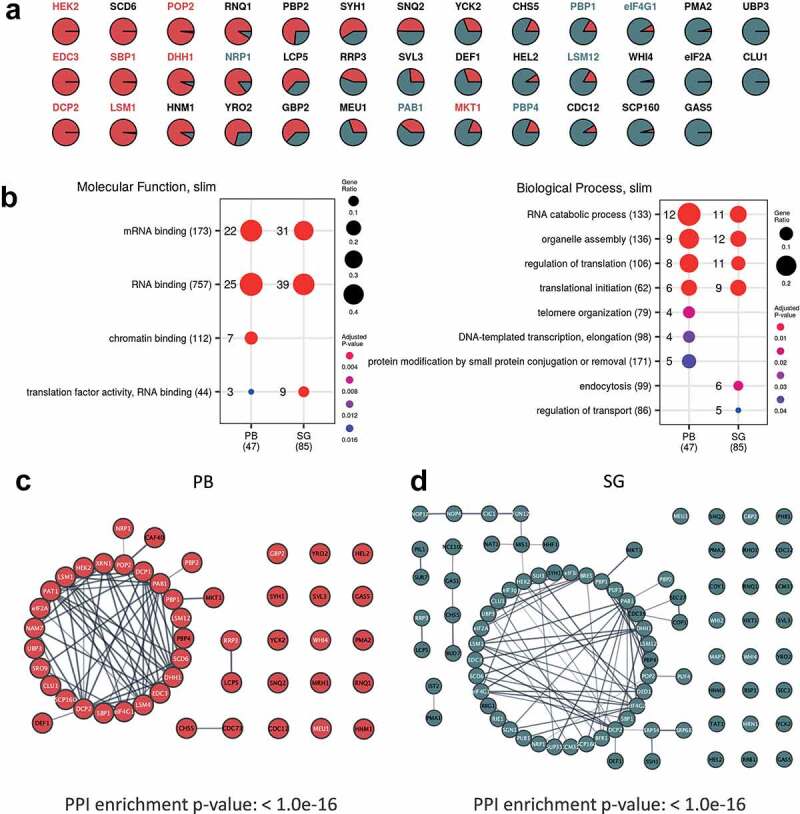
Figure 3.

Pre-PB and SG seeds exist prior to stress and act as sites of protein condensation. A. Cluster membership scores for proteins assigned to PBs and SGs. PB (cluster 7) membership coloured red and SG (cluster 11) membership coloured green. B. Functional categorization of proteins present in PBs and SGs following glucose depletion. The enrichment of GO slim Molecular function and Biological process terms are shown for PBs and SGs. Dots are scaled by the proportion of proteins annotated with a term and coloured by the adjusted P-value of enrichment taken from the complete analysis included in Fig. S2. C. Analysis of the network of predicted protein interactions (PPI) for PBs focussing on direct physical interactions. Each node represents a protein identified as a member of the PB cluster and previously identified protein:protein interactions are indicated by lines between the nodes. Proteins labelled in white are those that have an RNA binding GO annotation. D. Analysis of the PPI for SGs as for panel C
