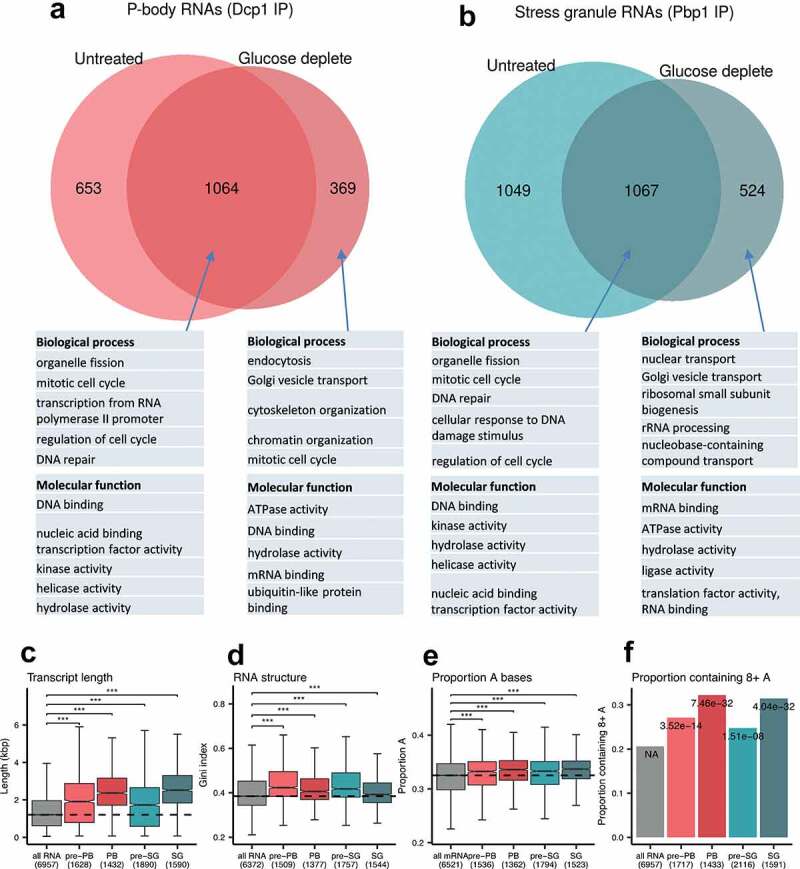
Figure 5.

Identification of RNAs isolated from PBs and SGs. Euler diagrams are shown comparing mRNA components of pre-PBs and PBs (A) and pre-SGs and SGs (B). The top five GO slim categories (Molecular function, Biological process) are shown for mRNAs that are uniquely associated with pre-PBs or pre-SGs (unstressed conditions), mRNAs that uniquely associate with PBs or SGs (after glucose depletion) and mRNAs that are identified with both pre-PBs and PBs, or with pre-SGs and SGs. The full GO analysis is shown in Fig. S6. (C) Box plots are shown comparing the transcript length of those RNAs enriched in pre-PBs, PBs, pre-SGs and SGs. (D) Comparison of RNA secondary structure [45]. (E) Comparison of adenosine content. (F) Comparison of polyA tract contents defined as runs of eight or more adenosine residues. All analyses are shown relative to data from the whole transcriptome as a background control. Significance, ***p < 0.001
