
Figure 7.
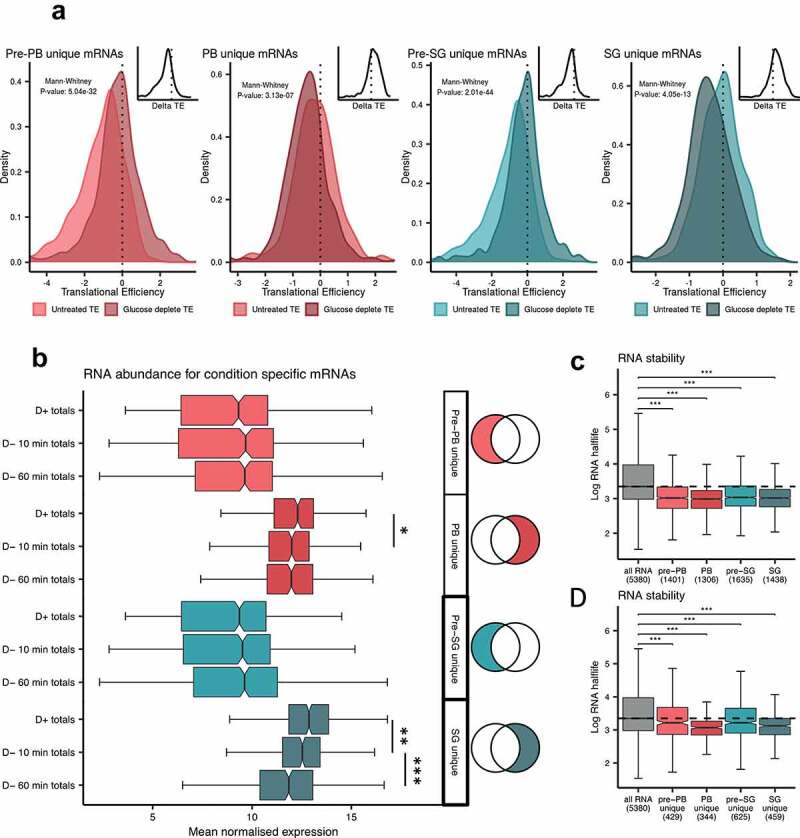
The translational efficiency of RNAs localized to condensates following glucose depletion is reduced. (A) Diagrams are shown comparing TEs determined from unstressed cells or cells following glucose depletion for mRNAs unique to pre-PBs, PBs, pre-SGs and SGs. Inset diagrams show the per mRNA delta between the unstressed and glucose deplete TEs. (B) Box plots are shown comparing transcript abundance of those RNAs which are uniquely enriched in pre-PBs, PBs, pre-SGs and SGs using data obtained from our transcriptomic analysis under non-stressed (D+), 10 min glucose depletion (D-) and 60 min glucose depletion (D-) conditions. Box plots are shown depicting the RNA stability of those RNAs enriched in our HMW complexes (C) and those RNAs uniquely enriched in our HMW complexes (D). Analyses are shown relative to data from the whole transcriptome as a background control. Significance, * p < 0.05, **p < 0.01, ***p < 0.001