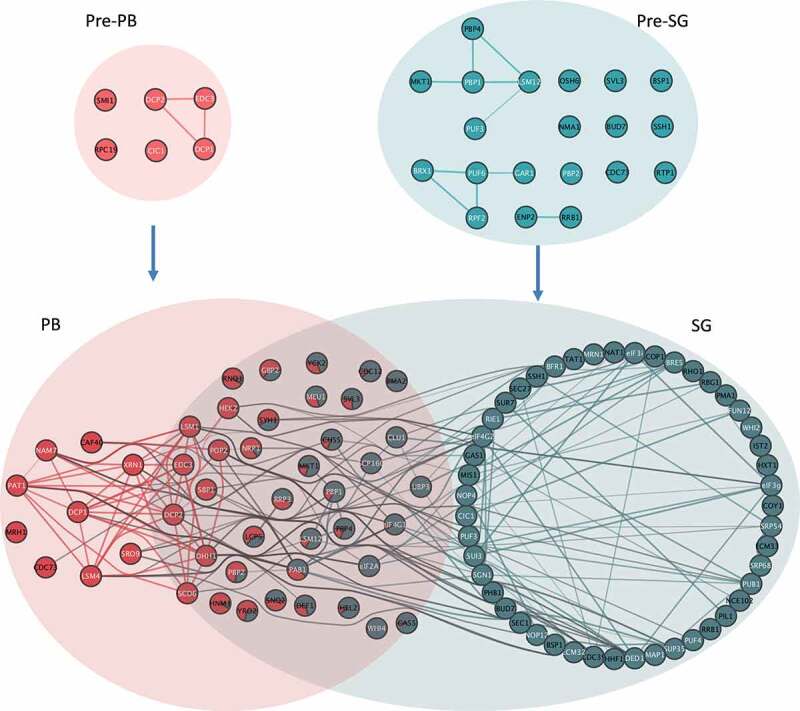
Figure 9.

Model of condensation of biomolecules into PBs and SGs. Overlaps between the networks of predicted protein interactions (PPI) for pre-PBs, pre-SGs, PBs and SGs are shown. Implicit PPIs between PB and SG members are contained within each coloured ellipsoids. Each node represents a protein identified as a member of an HMW complex cluster and previously identified protein:protein interactions are indicated by lines between the nodes. Proteins overlapping granules are represented by pie charts depicting cluster membership as in Fig 3A. Interactions between nodes both assigned uniquely or predominantly to the same granule type are coloured the same as the granule. Interactions between nodes uniquely or predominantly of different granules are coloured grey. Proteins labelled in white are those that have an RNA binding GO annotation
